

A Deep Dive on SoFi Technologies (SOFI)
The One-Stop Shop for All Things Finance

Introduction
As I explained to my paid subscribers in my portfolio review article, I started a position in SoFi Technologies (SOFI) about two years ago.
At that time, sentiment was poor with numerous analysts downgrading the stock and bears expressing doubts about the future of the company amidst a challenging macro backdrop.
But underneath all the FUD, there’s a business with accelerating fundamentals, a confident management team, and a bright future ahead.
That’s when I decided to bet big on the stock, accumulating shares in the $7 zone.
Fast forward to today, the stock is up about 200% with sentiment flipping 180 degrees — funny how price drives the narrative.
With the stock up so much over the past year, I’d like to revisit my full investment thesis on SOFI.
Without further ado, here’s my deep dive on SOFI.
Company
SOFI, or Social Finance, was founded in 2011 by four Stanford Graduate School of Business students: Mike Cagney, James Finnigan, Dan Macklin, and Ian Brady. Their goal was to create a platform offering affordable student loan financing.
Backed by 40 Stanford alumni, they launched a pilot loan program, lending $2M to approximately 100 Stanford students.
This experiment turned out to be a massive success, leading to further capital inflows from more banks and investors, enabling SOFI to expand to other schools nationwide.
Over the years, SOFI also introduced other products, including student loan refinancing in 2012 (a first in the industry), mortgages in 2014, and personal loans in 2015.
SOFI was booming.
But things took a turn for the worse in September 2017, when former CEO Mike Cagney resigned amid sexual harassment allegations, tarnishing the company’s reputation.
Fortunately, just four months later, SOFI hired the man who made SOFI today.

Being a former executive at world-class companies like Twitter, Goldman Sachs, and the NFL, SOFI’s new CEO, Anthony Noto, possesses all the necessary traits — leadership, financial acumen, and passion — to guide the fintech company to success.
Within a few years under his leadership, SOFI launched the Financial Services and Technology Platform segments, complementing its core Lending business. Additionally, Noto took SOFI public via a SPAC merger in 2021, valuing the company at $8.7B.
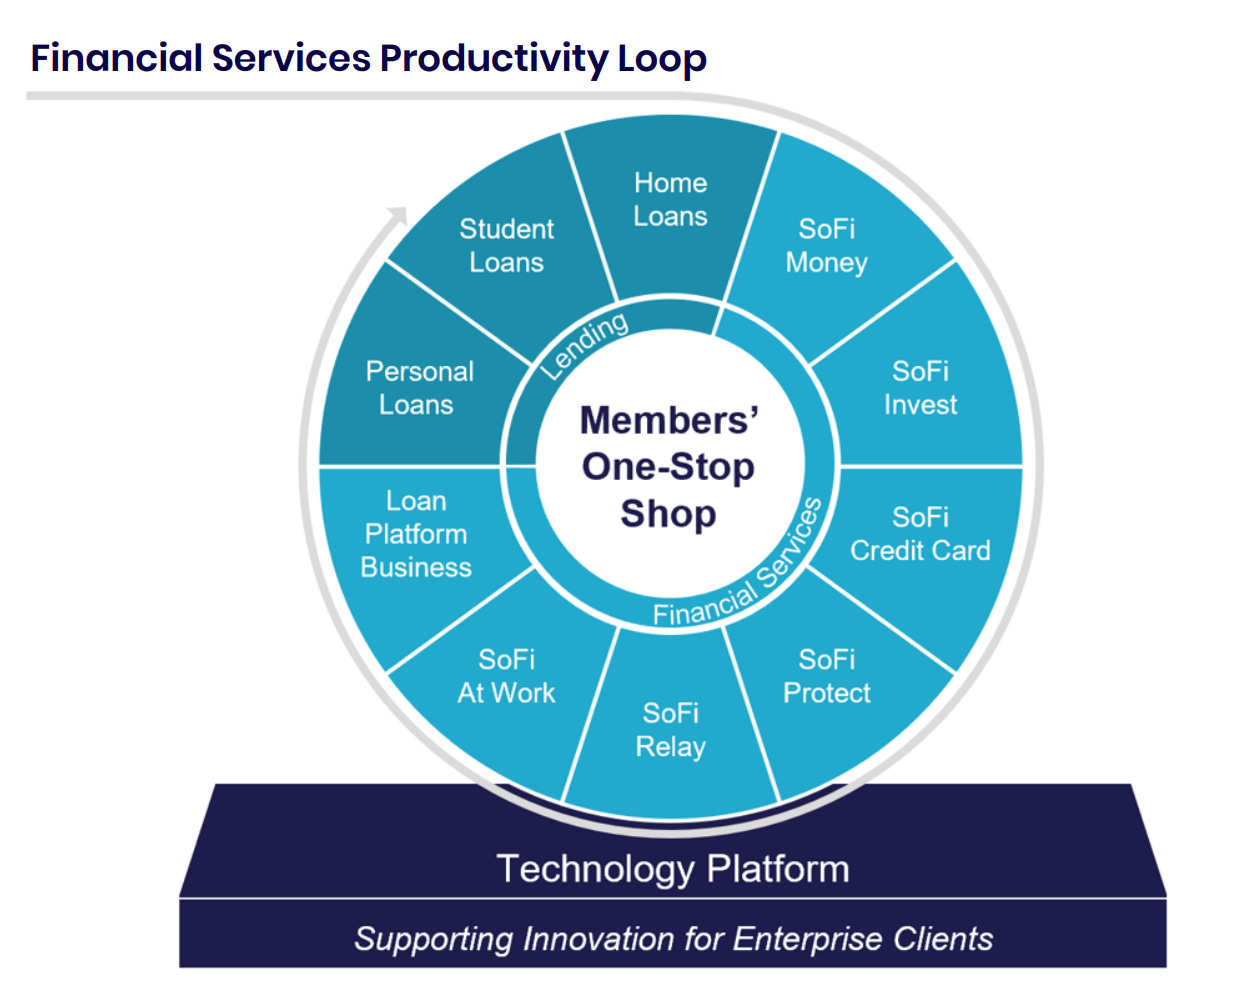
In a nutshell, SOFI is a fintech company that helps members get their money right by providing an all-in-one financial platform for them to borrow, save, spend, invest, and protect their money.
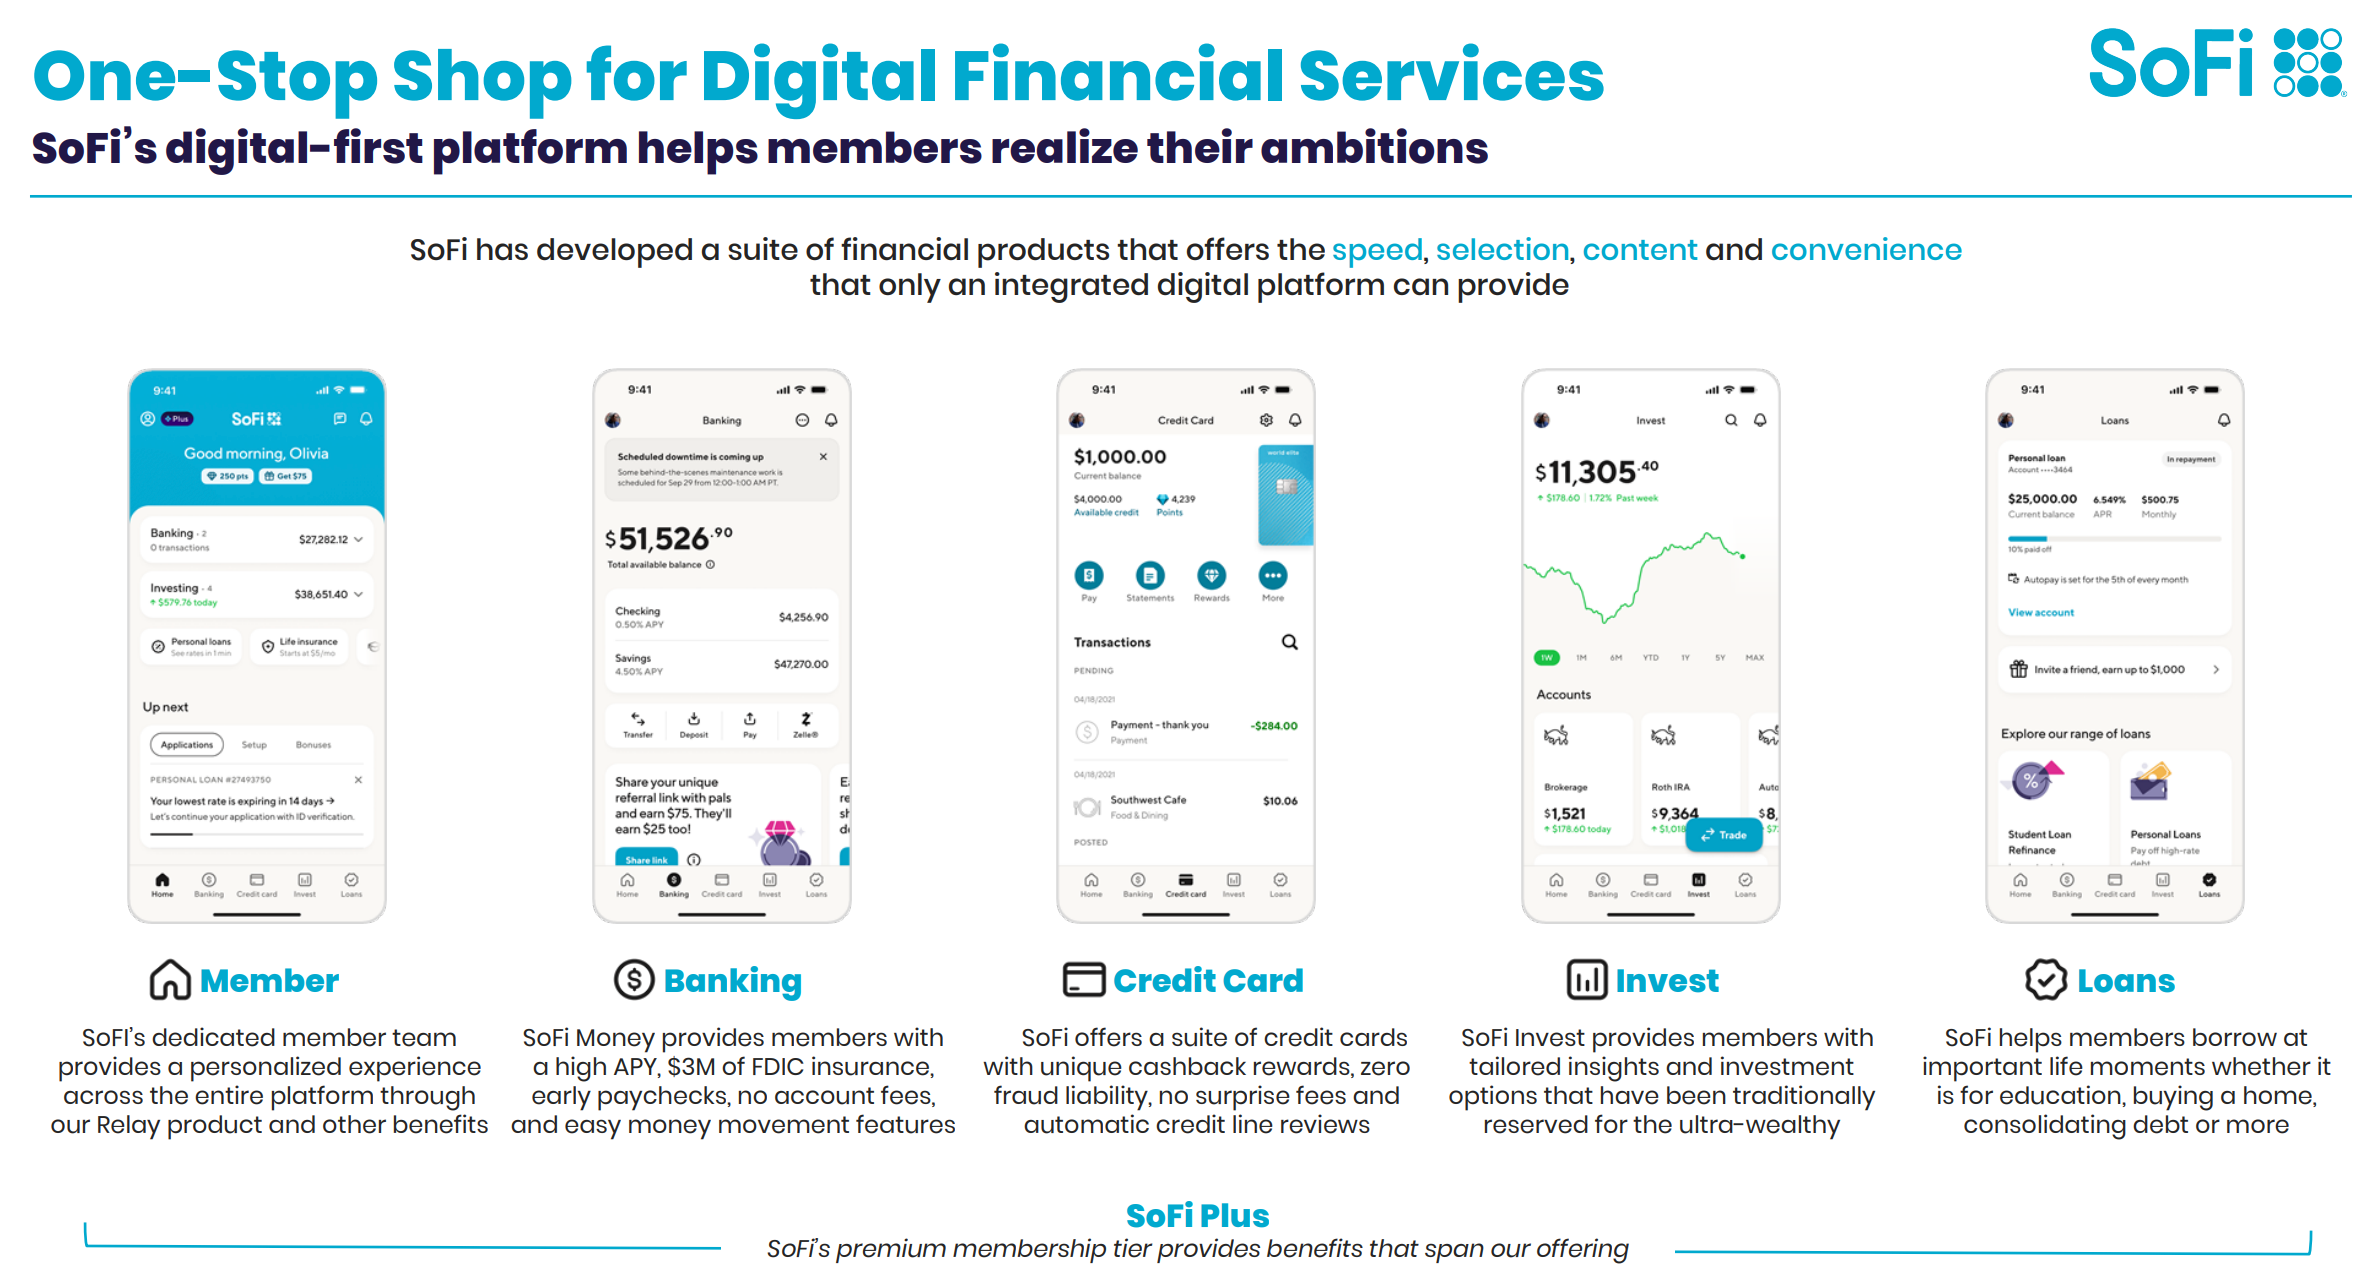
At a high level, SoFi operates three business units:
Lending: SOFI’s flagship Lending business offers products such as personal, student, and home loans, supporting the entire transaction cycle — including credit application, underwriting, approval, funding, and servicing — via a user-friendly mobile app experience. SOFI also offers loans through Lantern, a marketplace owned and operated by SOFI that connects borrowers with lenders.
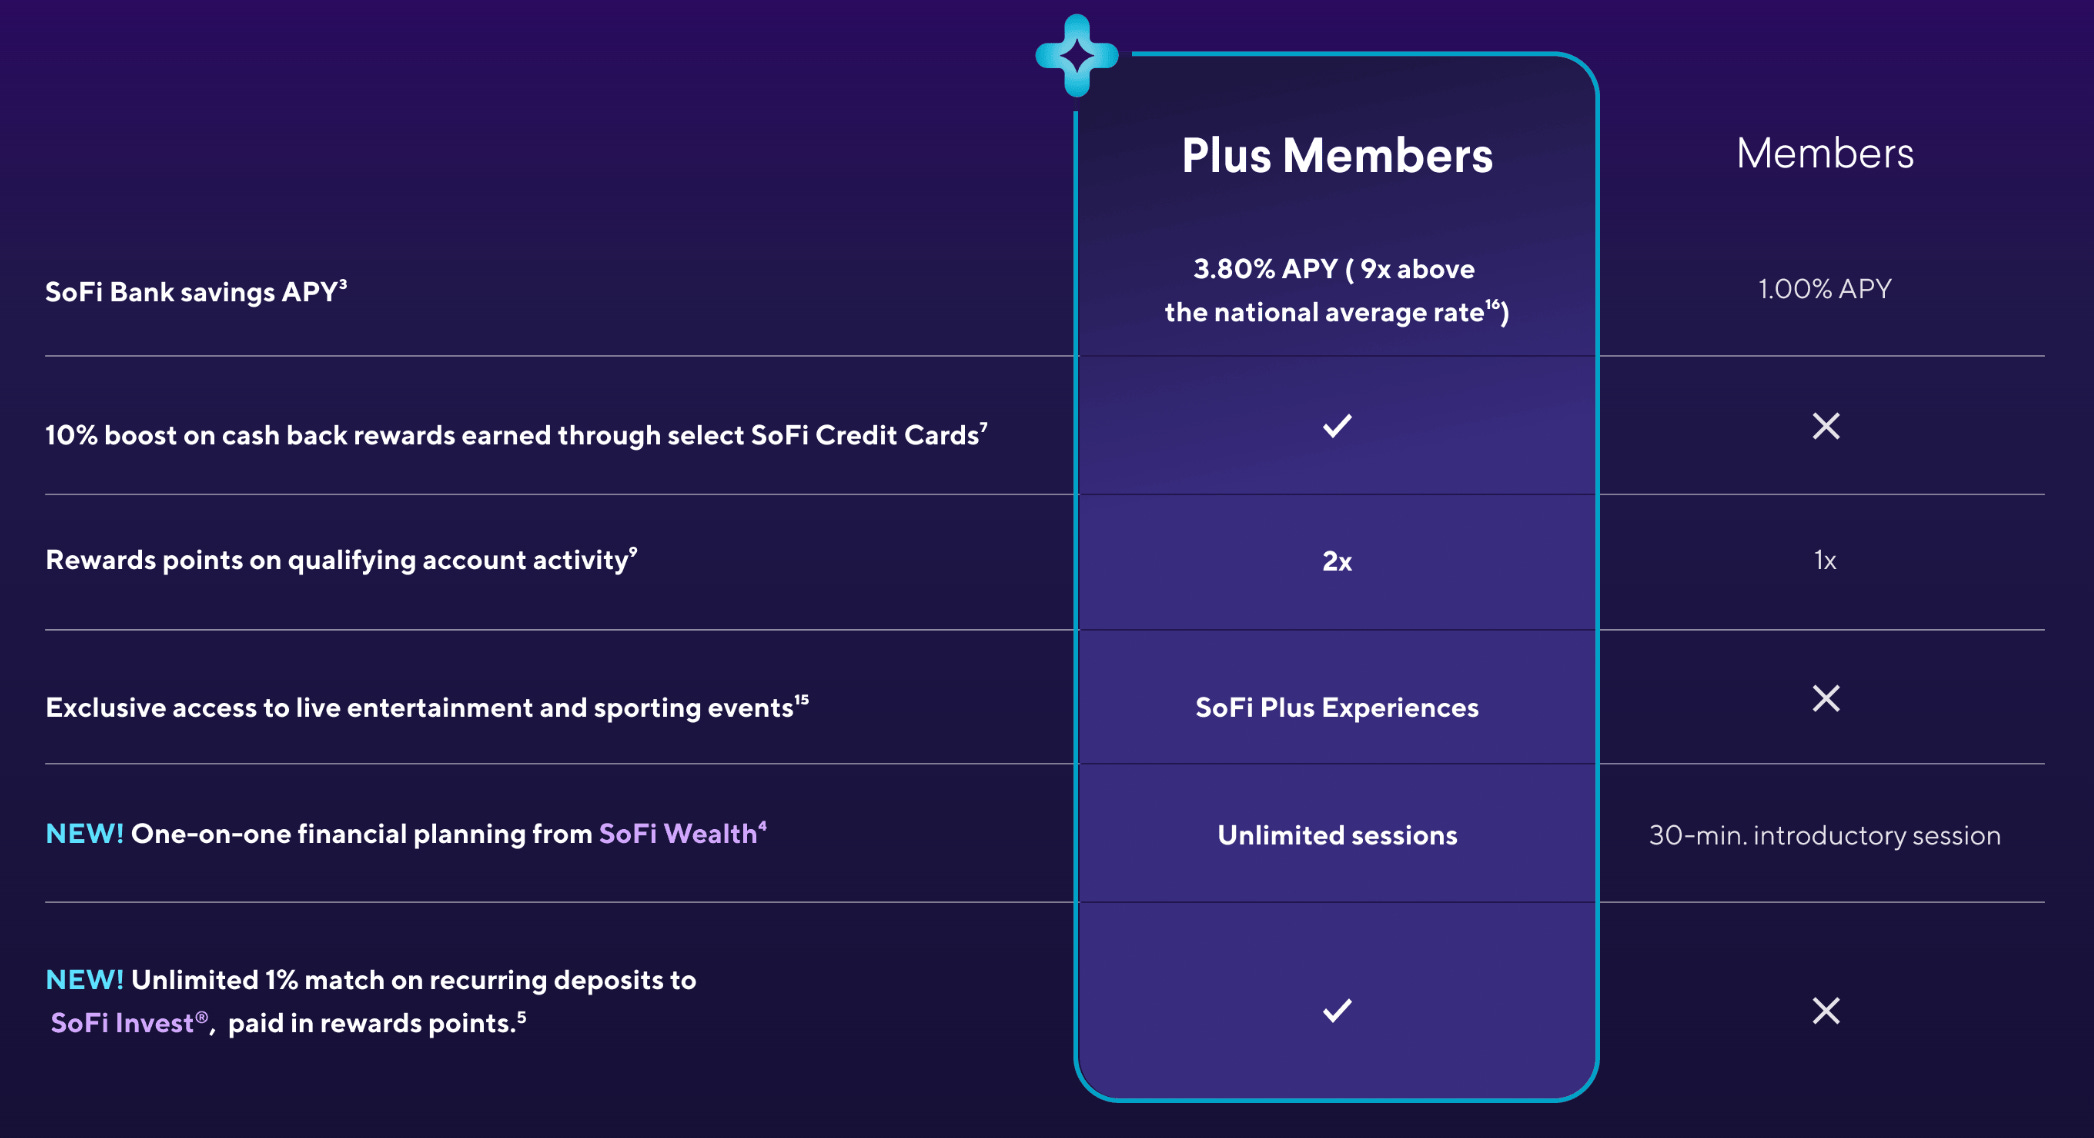
Financial Services: SOFI provides a comprehensive suite of digital financial services, including: checking and savings accounts (SoFi Money); stock, IPO, alternative, crypto (relaunching soon), and robo investing (SoFi Invest); credit cards with cashback rewards (SoFi Credit Card); credit score monitoring, budgeting tools, and expense tracking (SoFi Relay); and insurance through a partnership with Experian (SoFi Protect). In addition to all this, SOFI also offers a premium membership tier (SoFi Plus), providing exclusive benefits to premium members for just $10/month or free with eligible direct deposit.
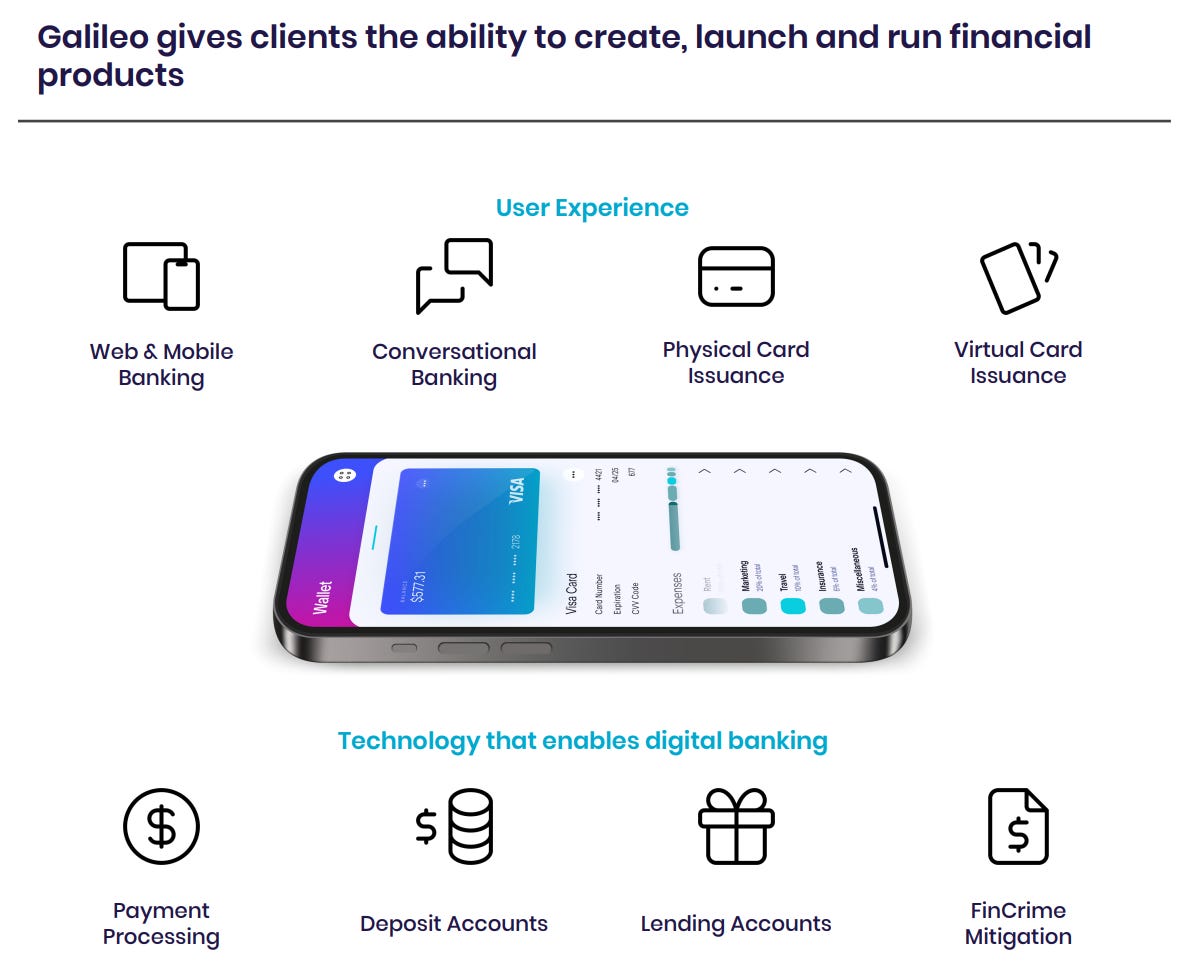
Technology Platform: Through its acquisitions of Galileo (a financial services API and payments platform) and Technisys (a cloud-based, digital multi-product core banking platform), SOFI offers enterprise clients a full-stack banking-as-a-service solution, which includes services such as digital banking, card issuing, payment processing, risk management, and more. In essence, the Tech Platform gives enterprises — including Dave, Robinhood, and Toast, to name a few — fintech capabilities.
Ultimately, through its three business units, SOFI aims to be the one-stop shop for all things finance, empowering individuals to reach financial independence and realize their ambitions.
SOFI’s competitive advantage comes from its vertically integrated fintech stack. For one, SOFI offers a single app where members can manage all their financials — loans, deposits, investments, you name it.. SOFI also holds a bank charter, allowing it to function as a bank for its members and enterprise clients. Often dubbed as the “AWS of Fintech”, Galileo also provides the backend financial and banking infrastructure for other enterprises, allowing them to offer financial services to their end customers.
Other neobanks like Block, Chime, and Revolut are some of SOFI’s closest competitors, but they lack the banking-as-a-service component that Galileo offers. Robinhood could be a strong contender as well, but it does not have a bank charter or offer loans to consumers. On the other hand, PayPal is not a direct competitor as it primarily focuses on digital checkout and payment processing.
In short, SOFI boasts a more complete technological stack than its competitors. Its vertically integrated platform also enables SOFI to gather more data in the fintech value chain.
Combined with its strong brand presence, SOFI is well-positioned to attract more and more members to the platform. High-profile marketing efforts — such as acquiring the naming rights for SoFi Stadium, becoming the official banking partner of the NBA, and sponsoring the tech-infused TGL golf league — enhance its visibility and credibility. Being recognized by NerdWallet as the Best Checking Account Overall, Best Checking Account for Overdraft Fee Avoidance, and Best Personal Loan Overall also strengthens SOFI’s brand. Importantly, SOFI’s mobile-centric fintech platform appeals to younger demographics, allowing SOFI to grow alongside them early in their lives.

By leveraging its strong brand and offering best-of-breed products, not only will more members flock to the SOFI ecosystem, but more members will also adopt more products within the platform. Strong cross-selling activity like this enables SOFI to introduce the second, third, and fourth products at virtually zero incremental cost, which significantly improves unit economics.
As SOFI gains economies of scale, SOFI can reinvest the profits back into the business, particularly in product innovation, further solidifying its value proposition.
CEO Anthony Noto beautifully explained SOFI’s cross-selling mechanism during the Q2 earnings call. It’s quite long, but it’s worth the read.
A member may come to us through SoFi Relay, a free product that analyze a member's finances and provides tangible options for how they can spend less than they earn so they can invest the rest. For perspective, it costs less than $15 to acquire a SoFi Relay member. Based on the ease of use and the quality of the insights, this member decides to move their checking and savings accounts from a big bank to our SoFi Money product. To get our best APY, the member enrolls in direct deposit, instantly making them a SoFi Plus member with access to our best benefits included unlimited access to financial planners, loan discounts, more rewards and unique experiences.
This member instantly goes from earning just two basis points of interest at the big bank to earning 3.8% at SoFi. So on $10,000 of saving deposits, they earn about $380 in annual interest compared to just $2 at the big bank. With this extra cash in hand, the member opens a SoFi Invest account taking advantage of the 1% match on recurring investment deposits, paid in reward points, another benefit of their SoFi Plus membership. Later, the same member sees a recommendation in their home feed to consolidate credit card debt where they are paying north of 20% interest into a SoFi personal loan at a rate in the low teens resulting in more savings. The member puts the money they save on a lower cost loan in a SoFi Vault to save for a down payment on a home and take advantage of our home lending product.
Every day stories like this unfold as members turn to SoFi products for every major decision in their financial lives and every day in between. Along the way, we're creating lifelong relationships that deliver real financial value to our members and to our business. Because these relationships often stem from just one initial product with one acquisition cost, we generate significantly more favorable unit economics. In the example above, we would generate a variable profit of about $1,800 on the personal loan before even considering the opportunity to grow the relationship with a home loan or other products.
As we do more with each member, we drive a higher lifetime value, which is our sustainable competitive advantage and allows us to continuously reinvest in our business to provide better products, lower interest rates on loans, higher rates on savings accounts, boost on recurring investments and even more free financial services and, in turn, driving the power of our virtuous cycle.
(CEO Anthony Noto — SOFI FY2025 Q2 Earnings Call)
Acquire, cross-sell, reinvest, innovate, repeat.
This is what management refers to as the Financial Services Productivity Loop (FSPL).
It’s also worth noting that SOFI’s banking charter allows the company to leverage customer deposits — instead of debt — to fund its lending operations, significantly reducing the cost of asset-backed financing. More on this later.
Additionally, as a neobank with no physical branches, SOFI incurs much lower overhead costs compared to traditional banks.
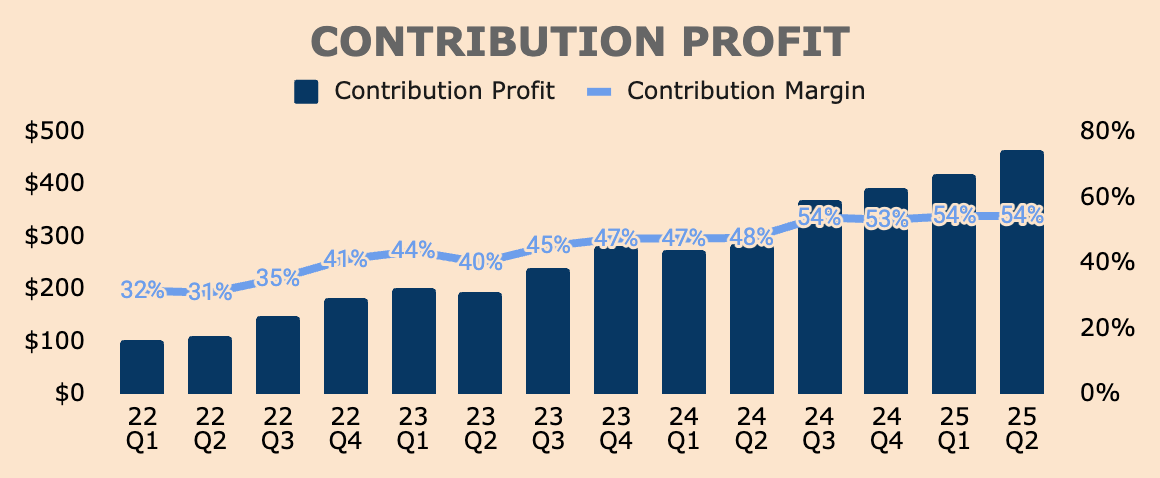
Altogether, the FSPL, banking charter, and neobank business model grant SOFI a cost advantage moat. This is evident from SOFI’s improving Contribution Margin — a metric similar to Gross Margin — which has gone nowhere but up and to the right, reflecting ongoing economies of scale and cost leverage.
With this cost advantage, SOFI can pass on the savings to members, further enhancing its value proposition. For example, SOFI can offer lower interest rates on loans and higher interest rates on savings accounts.
With that, I believe SOFI has the following competitive moats:
An all-in-one fintech stack, offering a full suite of financial products for all its members’ and enterprise clients’ financial needs.
A strong brand presence among the younger demographic enables SOFI to acquire customers early on and cross-sell its products over time.
A cost advantage over peers, fueled by the FSPL, banking charter, and neobank structure.
Through these moats, SOFI is disrupting the uninnovative, fragmented, and branch-heavy traditional banking industry. Importantly, SOFI is strategically positioned to capitalize on the massive industrial shift from traditional finance to fintech applications, generating monumental topline and bottom-line growth for years to come.
Growth
SOFI has printed exceptional growth numbers. Over the last five years, SOFI has grown Members, Products, and Revenue at a CAGR of 58%, 60%, and 50%, respectively.
In its most recent quarter, SOFI reported 11.7M Members, up 34% YoY. While growth rates have slowed down, SOFI added a record 846K New Members in Q2, marking the fourth straight quarter of record New Members that joined SOFI. Member growth is arguably the most important metric to track as it is a leading indicator of future Revenue growth.
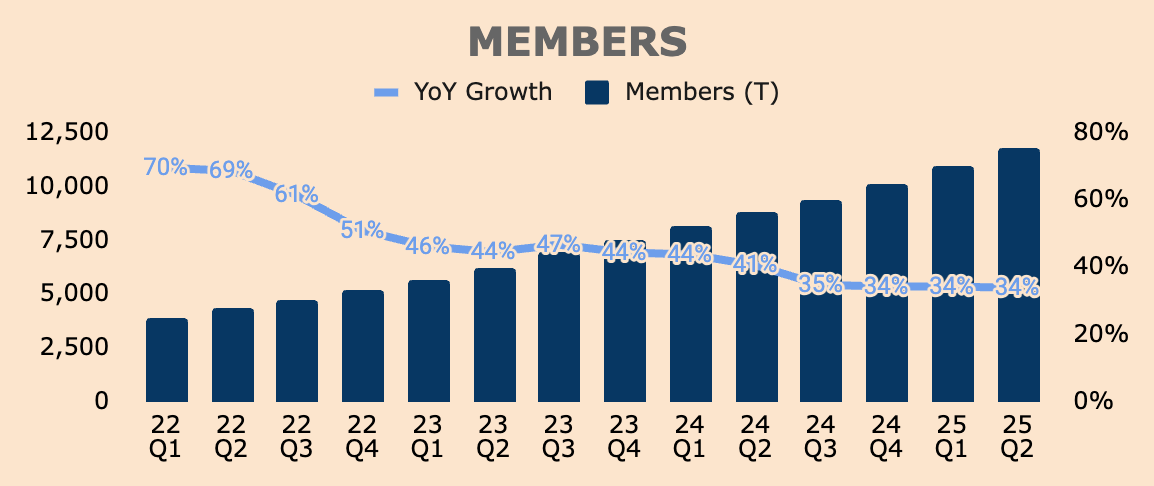
Frankly speaking, absolute member growth is more important than YoY growth at this point, since SOFI is growing over a much larger base, and seeing record New Members, yet again, is a testament to SOFI’s unique value proposition and brand momentum as the one-stop shop for digital financial services.
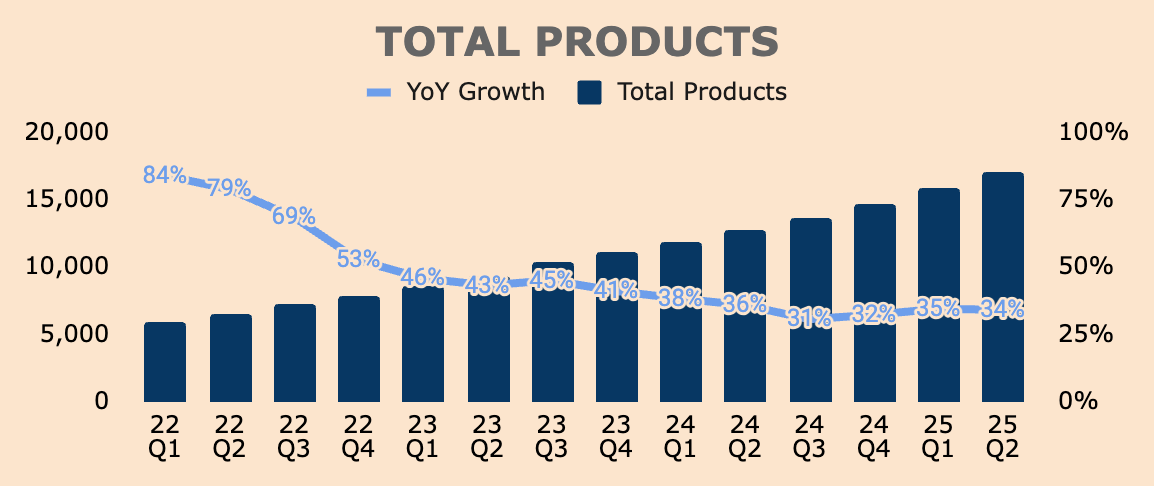
By the same token, SOFI added a record 1.26M New Products in Q2 — also the fourth straight quarter of record new adds — bringing Total Products to 17.1M, up 34% YoY.
Notably, existing members contributed to 35% of New Products opened in Q2, reflecting strong cross-selling activity.
SOFI reported $855M of Revenue, up 43% YoY. Adjusted Revenue came in at $858M, up 44% YoY.
The main difference between the two metrics is that Adjusted Revenue excludes the fair value changes in SOFI’s Lending segment, as they are non-cash charges.
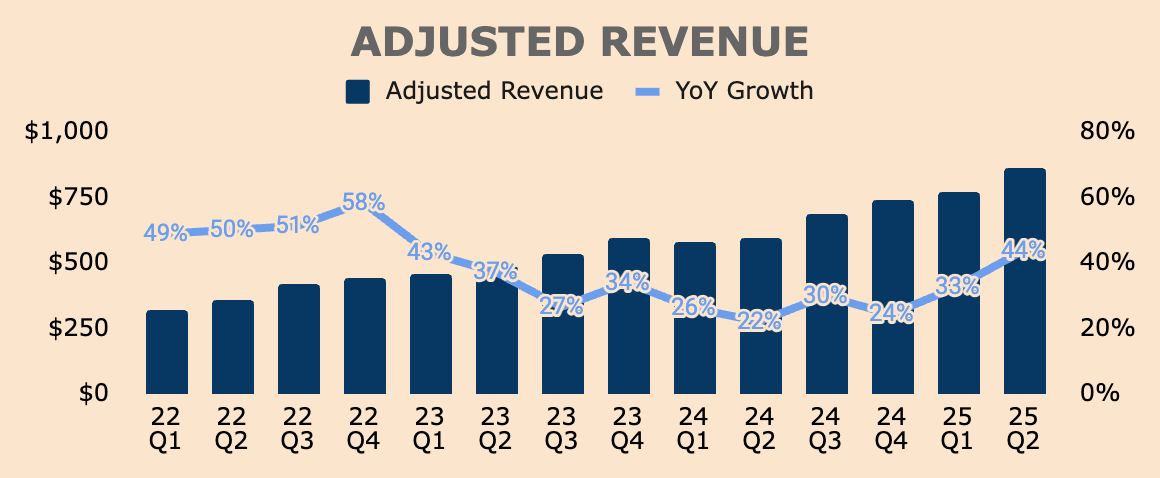
The acceleration in Adjusted Revenue growth, which is just impressive given the scale of the company, was driven by robust member and product growth, as well as the rapid expansion of Fee-Based Revenue.
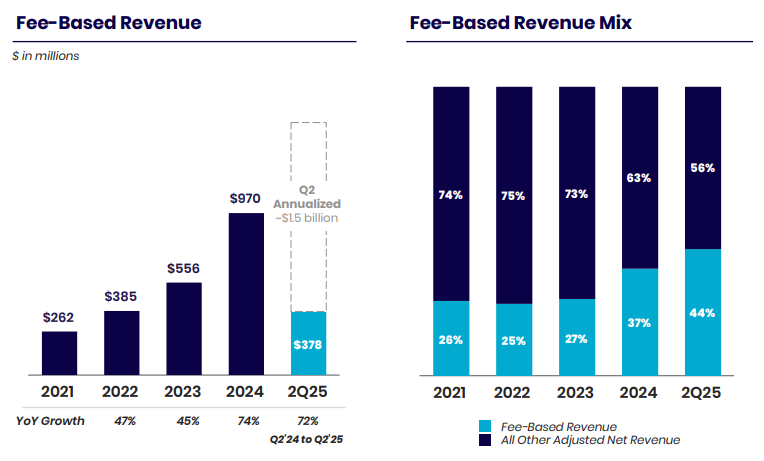
In Q2, Fee-Based Revenue was $378M, up 72% YoY, translating to an annual run rate of about $1.5B. Importantly, Fee-Based Revenue now makes up about 44% of the company’s Revenue, up from just 26% in 2021, reflecting SOFI’s diversification towards more capital-light, high-margin Revenue streams.
Let’s take a look at Revenue by segment.
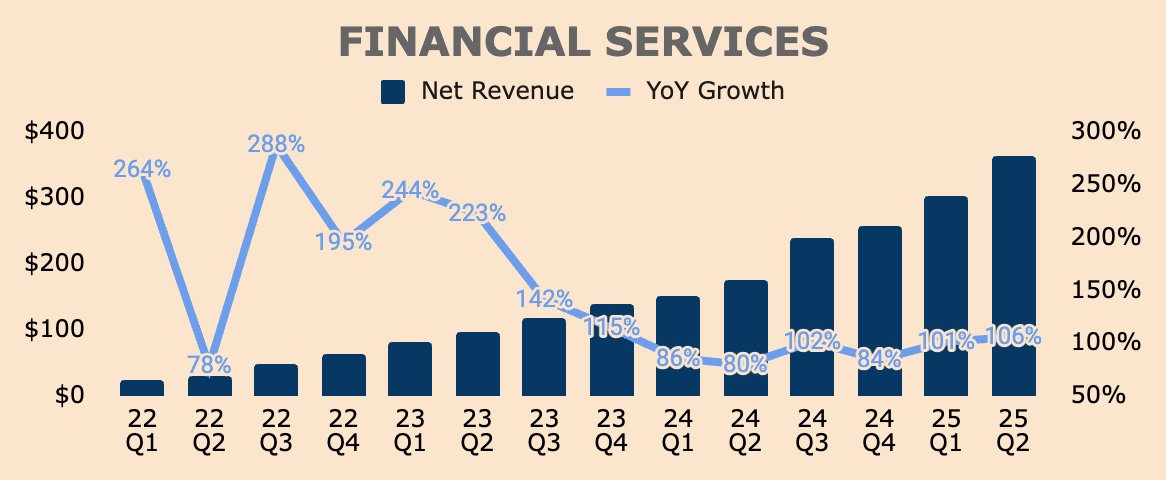
First, the Financial Services segment. Revenue for the segment was $363M, up a whopping 106% YoY. As you can see, the segment is in hypergrowth mode, growing at triple-digits over the past few years.
This hypergrowth was due to six reasons:
Strong Member growth of 34% YoY.
Strong Financial Services Product growth of 35% YoY to 14.9M.
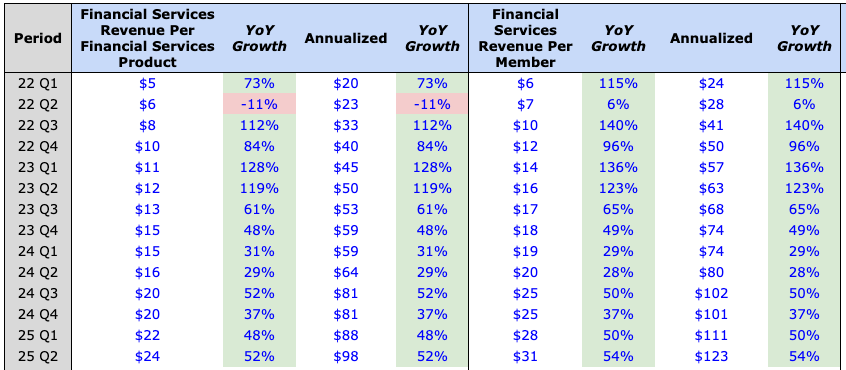
Improved monetization with Annualized Revenue Per Product up 52% YoY to $98 and Annualized Revenue Per Member up 54% YoY to $123.
Annualized Money and Credit Card volume of nearly $18B drove an 83% YoY growth in Interchange Fee Revenue to $27M.
Consumer deposits of nearly $30B drove a 39% YoY growth in Financial Services Net Interest Income to $193M.
The Loan Platform Business (LPB) contributed a 359% YoY increase in Financial Services Noninterest Income to $169M.
I want to discuss the last point a bit more.
In a nutshell, the LPB connects borrowers with third-party lenders.
It was initially designed to direct some of the loan applications that SOFI is unable to accept, perhaps due to failure to meet its underwriting standards, to third-party partners — management revealed that this amounts to $100B worth of loans per year.
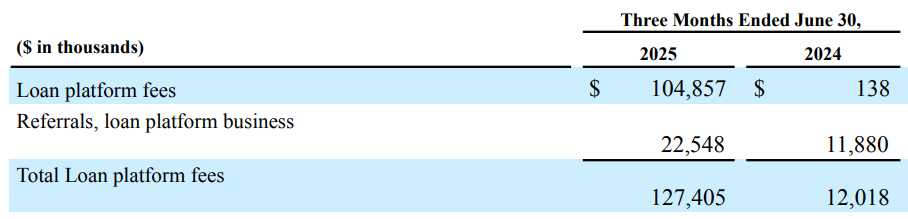
These loans are fulfilled through the Lantern marketplace. In return, SOFI earns a small referral fee for facilitating the transaction. This shows up as “Referrals, loan platform business” in SOFI’s financials.
However, in Q3 2024, management decided that instead of just receiving a small referral fee, how about SOFI leverages its customer acquisition, underwriting, and servicing capabilities to originate loans on behalf of third parties. After origination, SOFI transfers the loans to its partners — this happens in a matter of days, so SOFI doesn’t need additional capital or take any balance sheet risk.
In exchange for underwriting, originating, and transferring the loans, third-party partners pay SOFI a nice fee, much higher than the referral business (Lantern). This shows up as “Loan platform fees” in the financials, and as you can see, it has exploded to $105M in Q2, as compared to just $138K a year ago.
This new Revenue stream from the LPB is a game-changer as it allows SOFI to:
Scale in a capital-light manner, generating high-margin Revenue without taking unnecessary balance sheet risk.
Serve more members, well beyond its credit box, thus monetizing the $100B in unmet loan demand.
Retain member relationships, keeping them in the Financial Services Productivity Loop.
Having said that, the LPB is experiencing unprecedented demand at the moment, securing a total of $10.2B of LPB agreements with Fortress, Edge Focus, and Blue Owl Capital.
Since its expansion in Q3 2024, the LPB has originated about $6.1B of loans on behalf of third parties, leaving just $4.1B left on the pipeline. Here are the LPB volumes in the last four quarters:
Q3 2024: $1.0B
Q4 2024: $1.1B
Q1 2025: $1.6B
Q2 2025: $2.4B
In Q2, the LPB generated $131M of Revenue, up 37% QoQ, consisting of $105M of Loan Platform Fees, $23M of Referral Fees, and $3M Servicing Cash Flow (the first two items are recorded in the Financial Services segment, while the last one is recorded in the Lending segment).
In just four quarters, the LPB is now a half-billion-dollar business on an annualized run rate basis, and soon enough, it should be a billion-dollar Revenue business for SOFI.
Given the momentum of the LPB, I expect new deals to be announced in the next few months, taking the LPB closer to the $1B milestone. In addition, SOFI’s core Financial Services products should continue their growth trajectories. Altogether, the Financial Services segment should maintain its hypergrowth status in the next few years.
Moving on to the next segment, following years of growth pressure due to the student loan moratorium, challenging housing market, and high interest rates, the Lending segment is showing signs of life as growth has accelerated for five straight quarters.
Q2 Lending Adjusted Revenue was $447M, up 32% YoY. This was driven by a 27% YoY increase in average loan balances, a 28% YoY increase in Lending Products, and a 64% YoY increase in Loan Originations.

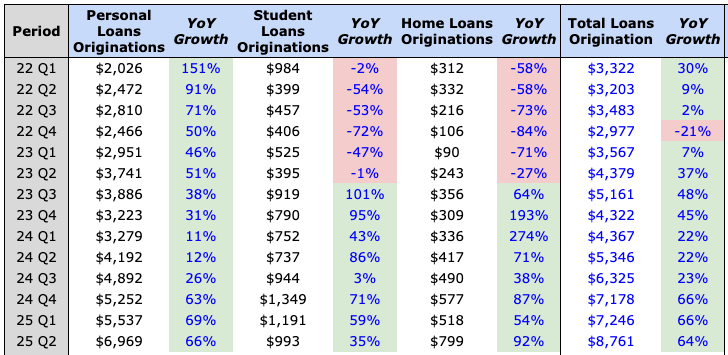
As mentioned, SOFI originated record volumes of $8.8B, up 64% YoY, with all three categories showing elevated demand:
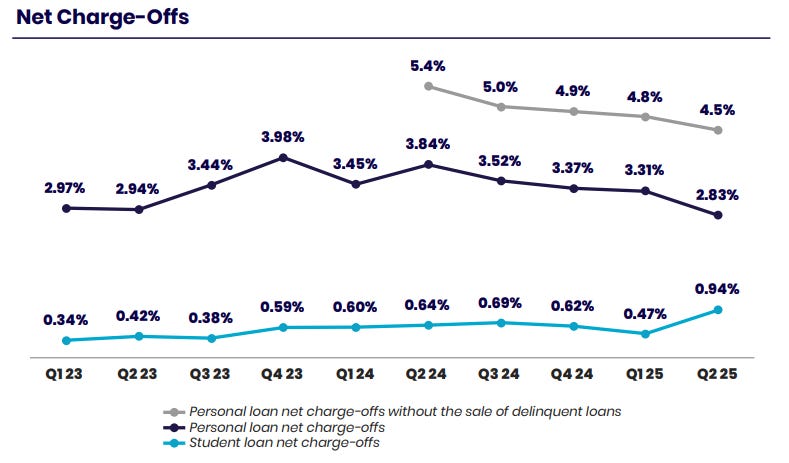
Personal Loan Originations were $7.0B, up 66% YoY. This includes $2.4B of LPB volume as discussed earlier. As you can see in the chart below, personal loan volume growth was slowing down in the better part of 2023 and 2024. However, the expansion of the LPB accelerated growth once again, as seen by the pick-up in volumes starting in Q3 2024. Since then, it’s all gas, no brakes.
Student Loan Originations were $993M, up 35% YoY. Student loan volumes peaked at $2.4B in Q4 2019, but fell sharply over the next few years as the COVID-19 pandemic prompted the Trump Administration to enact the student loan moratorium, which was extended multiple times. However, the moratorium officially ended in August 2023, thus resuming student loan payments. As such, student loan volumes surged in Q3 2023 and have now reached a sizeable cadence, though not as high as it used to be. Nevertheless, the category still has the potential to return to pre-pandemic levels, which is about double its current volume.
Home Loan Originations were $799M, up 92% YoY. Home loan volumes took off in 2020 and early 2021 as ultra-low interest rates increased demand for home mortgage applications and mortgage refinancing. However, demand quickly dried up after a series of rate hikes by the Fed, as seen by the negative growth rates in 2022. Management did not sit still but took the opportunity to prepare the company for any demand rebound, acquiring Wyndham Capital Mortgage in April 2023. Since then, home loan volumes have steadily ramped, to now achieving record volumes in Q2.
Taking everything into account, I believe the Lending business should continue its robust momentum. Crazy thing is, SOFI is registering all this growth while interest rates remain elevated. Just imagine how much demand will come knocking on SOFI’s door once rates start to come down.
Last but not least, we have the Tech Platform segment, which generated $110M of Revenue in Q2, up 15% YoY, driven by improved monetization of existing clients and new client deals.
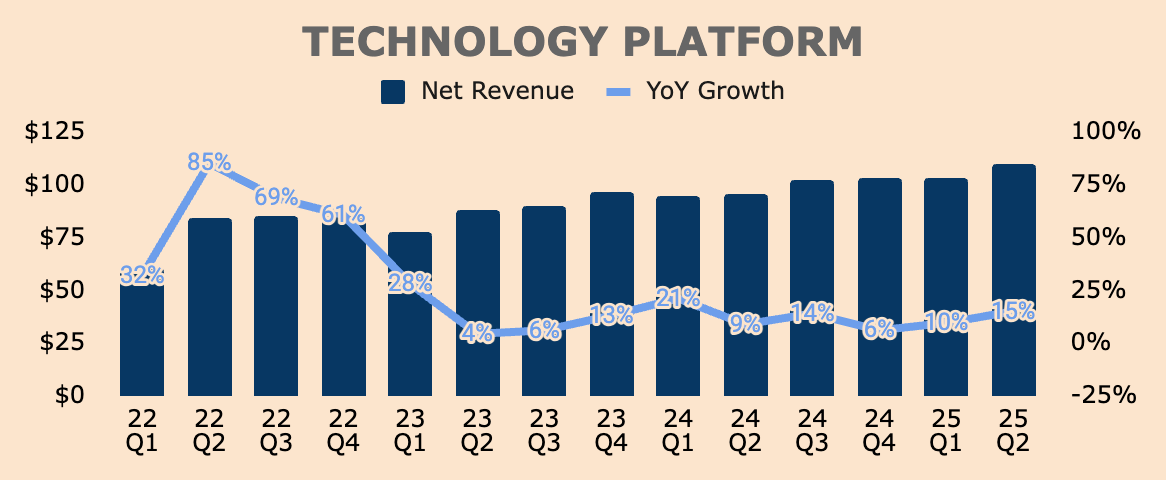
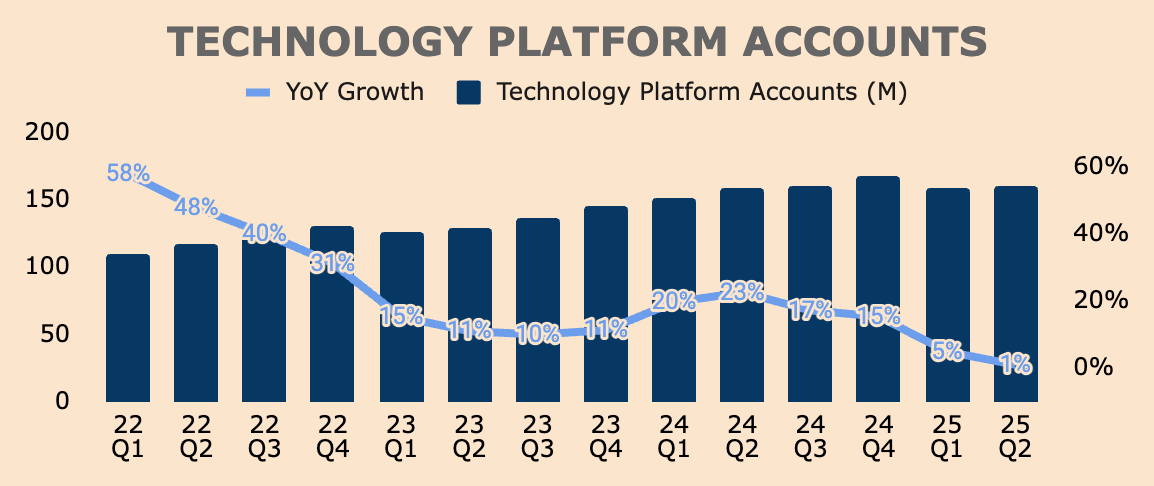
Growth has been pretty muted for this segment, largely due to slowing account growth, which totaled 160M in Q2, up just 1% YoY. It’s worth pointing out that Galileo lost a major customer in Q1, which resulted in a 10M sequential decline in accounts.
This customer is likely to be Chime, a neobank that recently went public. In its IPO prospectus, Chime highlighted that the company is in the process of transitioning its debit card processor from Galileo to ChimeCore, its in-house payment processor.
This is a concern as it shows that Galileo’s technology may not be as sticky or as differentiated as some might expect. Granted, Chime is a fintech company, so it does have the technical know-how to develop its processing platform.
But what if other fintech clients — like Dave, Robinhood, or Toast, among others — decide to build their own processing platform as well? In my opinion, that would have a profound negative impact on the segment, and that’s a risk worth considering.
On the positive side, a robust deal pipeline awaits the segment — expect Revenue growth to reaccelerate in the coming quarters.
Earlier this year, Tech Platform launched a first-of-its-kind Rewards Debit Program with Wyndham Hotels & Resorts, and we've signed 2 additional travel and hospitality companies that are expected to launch before the end of this year. In total, we anticipate having approximately 10 new clients that contribute revenue in Q1 2026 that did not contribute revenue in Q1 2025.
(CEO Anthony Noto — SOFI FY2025 Q2 Earnings Call)
All in all, SOFI is showing phenomenal growth. Financial Services is exploding. Lending is accelerating. Tech Platform is ramping.
And management sees this momentum continuing. Here’s what they guided this year:
2025 Adjusted Revenue of $3,375M, implying a 30% YoY growth. This guidance was raised by about $100M.
Member growth of at least 3M, implying a 30% YoY growth. This guidance was raised by 200K Members.
Not to mention, management has a history of sandbagging guidance and then destroying and raising it. Also, SOFI has a perfect track record of beating analyst Revenue estimates.
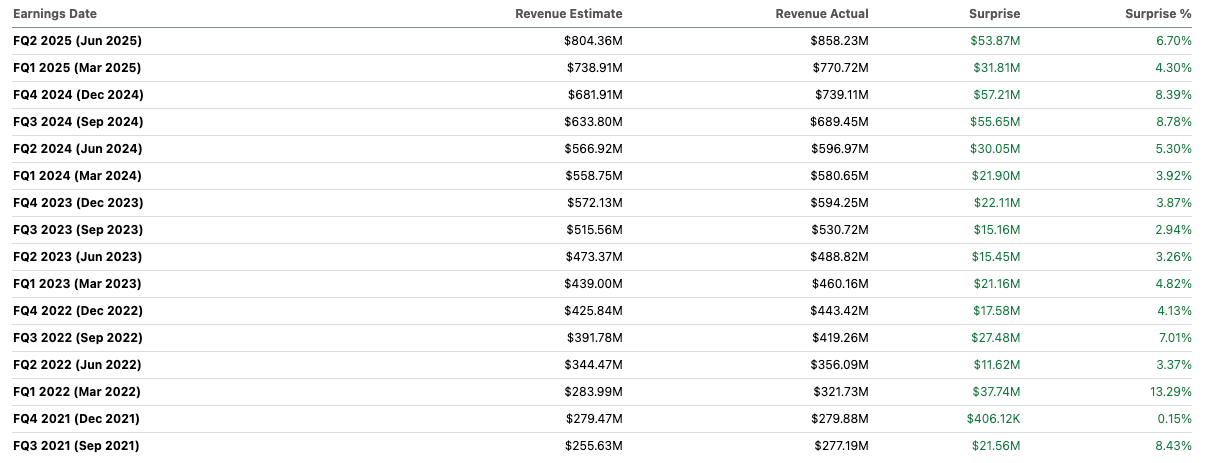
Given their tendency to underpromise and overdeliver, I wouldn’t be surprised if SOFI ends up growing both Revenue and Members by 35% this year.
Regardless, I believe SOFI is still in its early stages of growth — it’s just getting started.
Opportunity
Despite its incredible growth momentum, SOFI has yet to fully realize its potential as the next-generation banking platform.
Expanding its member base will be the most obvious growth lever for the company.
SOFI currently has about 12M members, which pales in comparison to JP Morgan and Bank of America, which serve more than 84M and 68M consumers, respectively. SOFI’s 12M-member figure also means that it has only a 3.5% market penetration rate against 347M people in the US.
Given how big its incumbent peers have gotten, it’s not too crazy to assume that SOFI can amass 50M members in its lifetime — that’s about 15% of the US population. Getting to this milestone, however, hinges on its ability to continue to take market share from legacy banks, which I believe SOFI is well-positioned to do so over the next decade, as consumers migrate from traditional to digital.
Nevertheless, getting from 12M to 50M members is a 4x in size from here, which should take SOFI stock to new heights.
Another growth driver would be increasing multi-product adoption.
As of Q2, Product Per Member is only about 1.46, meaning members use fewer than two products on average. This figure is quite low, considering that SOFI offers nine major products, namely: personal loans, student loans, home loans, Money, Invest, Credit Card, Referred Loans, Relay, and At Work.
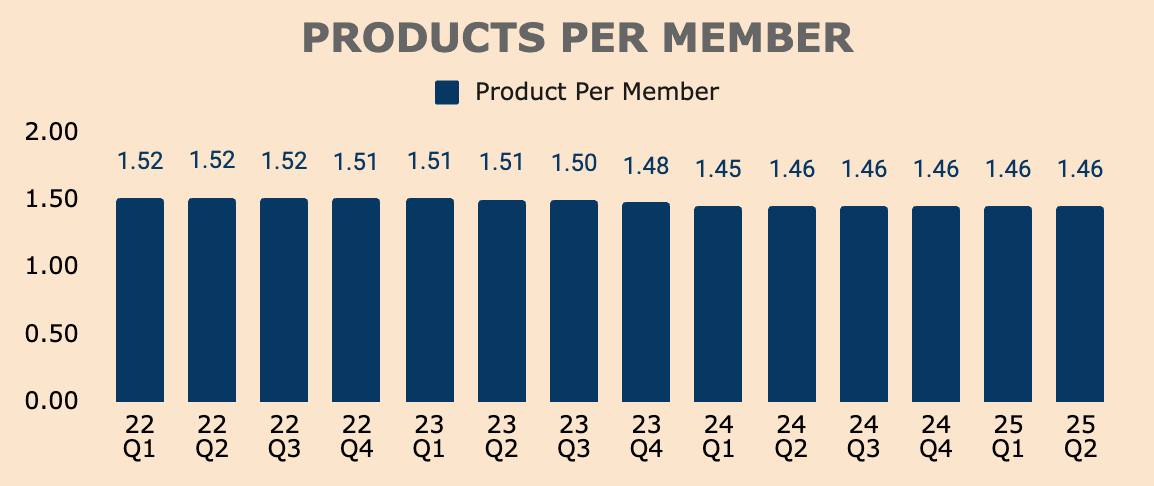
However, it’s worth noting that SOFI is currently growing its member base rapidly, which puts pressure on the Product Per Member metric, as new members tend to use only one product initially. Over time, I expect members to adopt more products as they are continually exposed to other products in SOFI’s all-in-one app.
That said, through product innovation and marketing initiatives, SOFI has the potential to boost cross-buying rates and member monetization. For isntance, SoFi Plus (the company’s premium membership tier) is showing solid traction in terms of converting members to the second and third products. Continued rollout of SoFi Plus will be key in driving multi-product adoption.
Nearly 90% of new SoFi Plus subscribers were existing members, demonstrating the value of making this product more accessible. Of these members, nearly 30% adopt an additional product within 30 days of enrollment. Among SoFi Plus subscribers who are completely new to SoFi, over 75% adopt at least a second product, and over 40% adopt a third product within 30 days of enrollment.
With this in mind, just imagine how much more Revenue SOFI could extract if Product Per Member rises to three or even four.
Operating in a massive industry — and disrupting the very incumbents that define the industry — also provides a huge growth tailwind for SOFI.
Taking a look at the Total Addressable Market of each of SOFI’s segments gives us a better understanding of how big SOFI’s opportunity is:
Lending:
The US student loan market is worth more than $1.7T, covering 43M borrowers.
The US personal loan market is worth about $253B, covering 25M borrowers.
The US mortgage market is worth about $12.8T, covering 86M borrowers.
Financial Services:
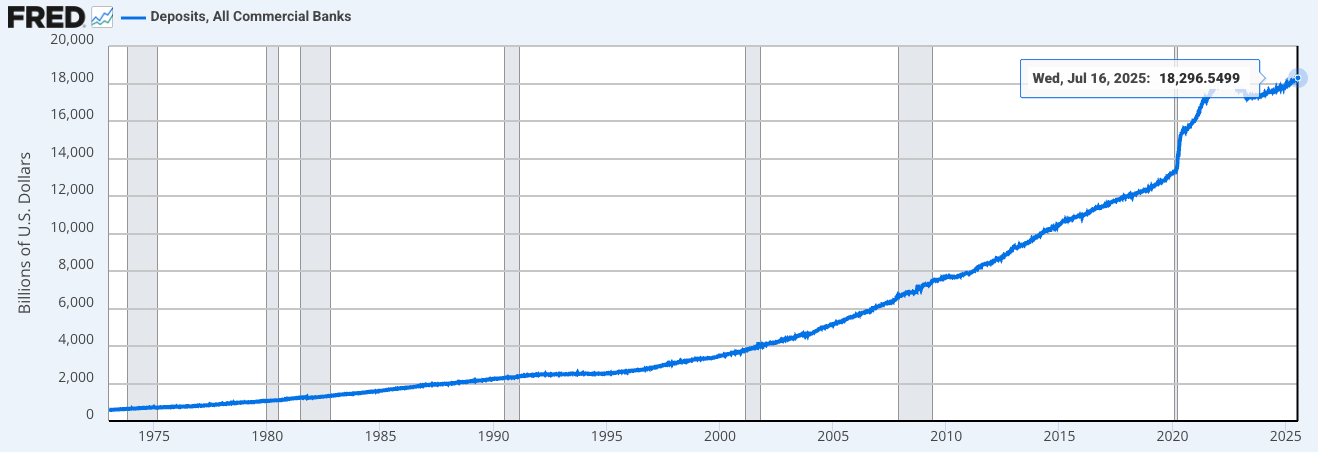
The US commercial banking market holds $18T of consumer deposits.
According to NASDAQ, retail investors trade $30B per day, which is about $7.8T of trade flows per year.
Per CapitalOne, US consumers charged over $10T of volume to their Visa, Mastercard, and American Express credit cards in 2024.
Not to mention the massive untapped crypto market.
Tech Platform:
Multiple industry analysts estimate that the banking-as-a-service and embedded finance markets are worth at least $100B combined.
As you can probably tell, SOFI’s TAM is gigantic — and it’s up for grabs.
Of course, SOFI only targets a subset of its TAM, perhaps “only” $1T to $2T of the aggregate market.
And this is only for the US market. How about international markets? Well, SOFI Invest is already live in Hong Kong, and they just received approval to offer crypto products in the country.
Speaking of which, SOFI hasn’t even relaunched crypto offerings yet, which could be massive. Additionally, interest rates haven’t even come down yet. These two alone could supercharge SOFI’s growth.
Nevertheless, we can see that SOFI is nothing but a speck of dust in the financial universe, which is good news for investors because it means that SOFI is still in the early chapters of its growth story.
Importantly, CEO Anthony Noto aspires to scale SOFI to a top 10 financial institution. As of the end of Q1, the Federal Reserve ranked SOFI Bank as the 60th largest commercial bank in the US by consolidated assets.
The 10th position belongs to State Street Corporation, with $368B of consolidated assets.
SOFI Bank? Only $32B of assets.
In other words, SOFI needs to increase assets by at least 1,000% to achieve top 10 status.
With the company arguably in its best shape ever — financial-wise, moat-wise, momentum-wise — SOFI is well on track to become a top 10 financial institution within the next decade or so.
That is, perhaps, the ultimate bull thesis on SOFI.
Profitability
As SOFI scales further, earnings should compound as well.
Contribution Profit — which is Net Revenue minus direct expenses — was $466M in Q2, up 64% YoY. Contribution Margin hovered at a record high of 54%, up 6pp YoY, indicating efficiency gains.
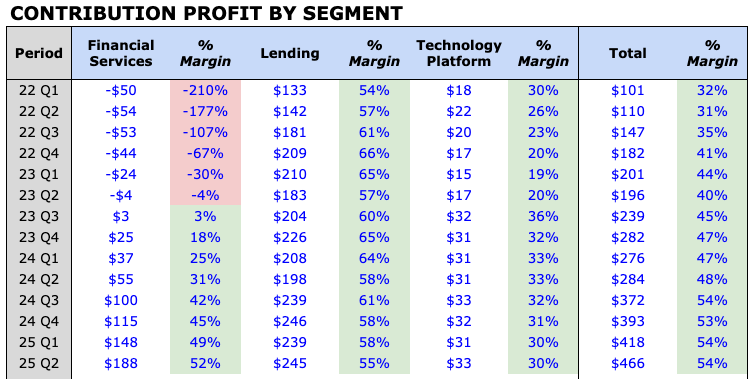
Breaking it down by segment, we can see that all three segments produced robust profits in Q2:
Financial Services Contribution Profit was $188M at a 52% Margin, which improved 21pp YoY and 3pp QoQ. This was driven by a 106% YoY increase in Revenue while direct expenses increased only 50% YoY. The outsized growth of the LPB is likely to be margin-accretive due to its capital-light, high-margin nature. Continued expansion of the LPB should drive Financial Services Contribution Margin higher, possibly to as high as 60%.
Lending Contribution Profit was $245M at a 55% Margin, which is down 3pp YoY and QoQ. One major reason why margins declined was that Net Interest Margin dropped 15bps sequentially to 5.86%. This was due to “a modest mix shift” from higher-yielding personal loans to lower-yielding student loans. It’s also worth noting that the student loan charge-off rate increased 47bps sequentially to 0.94%, which also pressured Lending Contribution Profit. During the earnings call, management clarified that this was due to: 1) switching servicers, which caused some charge-offs to be delayed from Q1 to Q2, and 2) purchasing a portfolio of student loans that had a higher, but expected, charge-off rate. Excluding these two items, normalized charge-off rates would be about 0.64% in Q1 and 0.68% in Q2. Moving forward, management expects charge-off rates to stabilize at these levels, so Lending Contribution Margin should improve from here.
Tech Platform Contribution Profit was $33M at a 30% Margin, which is down 3pp YoY but stable QoQ. Margins should remain in the 30% range for the foreseeable future.
Adjusted EBITDA was $249M, up 81% YoY. This represents an Adjusted EBITDA Margin of 29%, which improved 6pp YoY and 2pp QoQ. This was driven by higher Contribution Margins as well as leverage in Noninterest Expense, as outlined below:
Technology and Product Development: down 4pp YoY
Sales and Marketing: flat YoY
Cost of Operations: flat YoY
General and Administration: down 5pp YoY
Encouragingly, Share-Based Compensation as a % of Revenue reached an all-time low of 7% in Q2, down 3pp YoY.
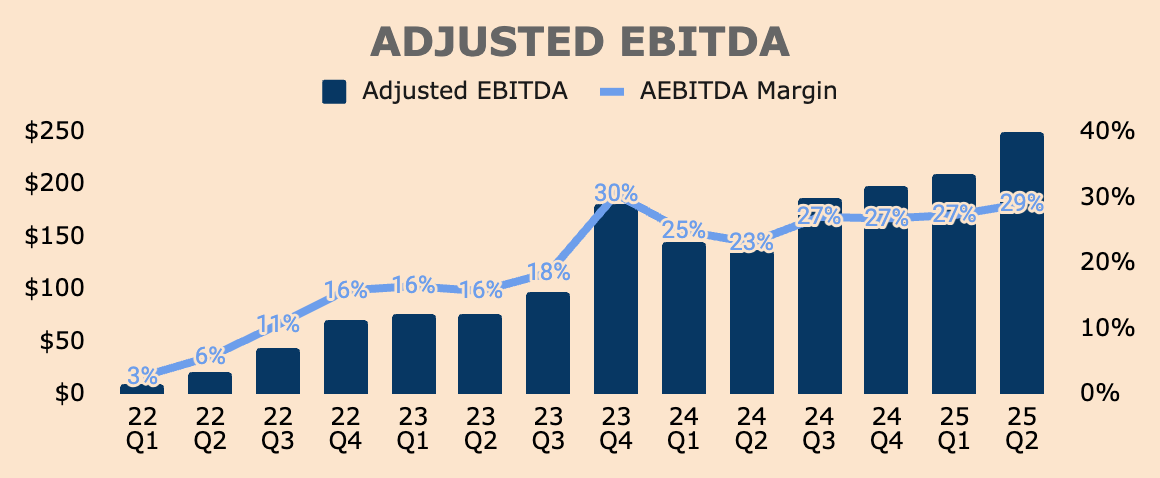
Of important note, Incremental Adjusted EBITDA Margin — which is the change in Adjusted EBITDA divided by the change in Revenue — was 43% in Q2. In other words, for every additional $100M of Revenue SOFI earns, it subsequently generates $43M of Adjusted EBITDA. This metric is important as it indicates that SOFI’s long-term Adjusted EBITDA Margin profile could reach as high as 40%.
That said, expect minimal margin improvement in the next few quarters as management guided for 2025 Adjusted EBITDA of $960M, implying an Adjusted EBITDA Margin of 28%. This guidance was raised by $75M and 1pp, respectively.
Again, management could be sandbagging here.
In terms of the bottom line, SOFI produced its seventh straight quarter of GAAP profitability. In Q2, GAAP Net Income was $98M at an 11% Net Margin, which improved 8pp YoY.
GAAP EPS was $0.08, up 700% YoY.
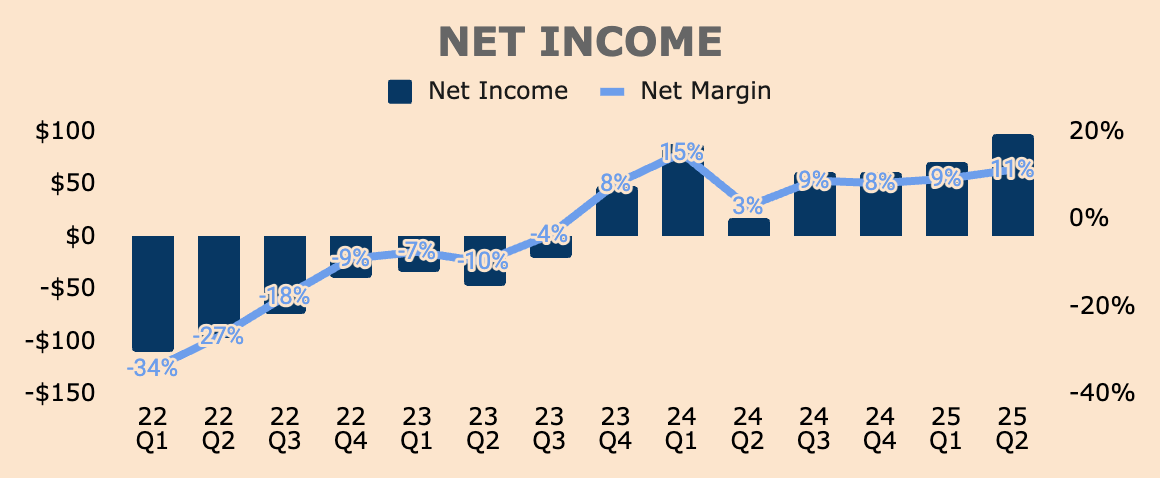
Looking ahead, management expects 2025 Net Income of about $370M at an 11% Net Margin. This guidance was raised by $45M and 2pp, respectively.
GAAP EPS guidance was also raised by about $0.04 to $0.31 for the full year. In addition, management remains confident in achieving their 2026 EPS target range of $0.55 to $0.80. I think SOFI is going to blow past the top end of that range.
Whatever it is, I believe SOFI is still early in its profitability journey.
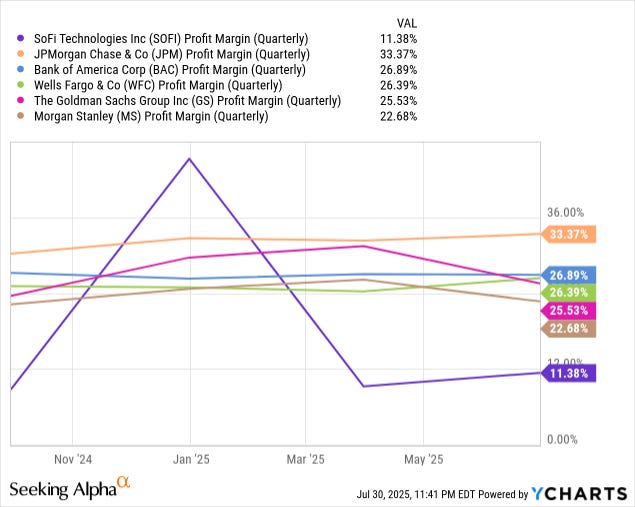
Looking at the Net Margins of some of the most prominent legacy banks gives us a clue as to how profitable SOFI can get over the long term. Judging by the profitability of its peers, it’s safe to assume that SOFI can, at the very least, double or even triple its current Net Margin of 11%.
Remember, SOFI has a cost advantage moat due to its FSPL, banking charter, and neobank structure, so SOFI could potentially achieve a higher Net Margin profile than the big banks, including industry leader, JP Morgan.
In any case, we can expect SOFI to compound earnings for decades to come, fueled by strong growth momentum, strong operating leverage, and strong execution.
Health
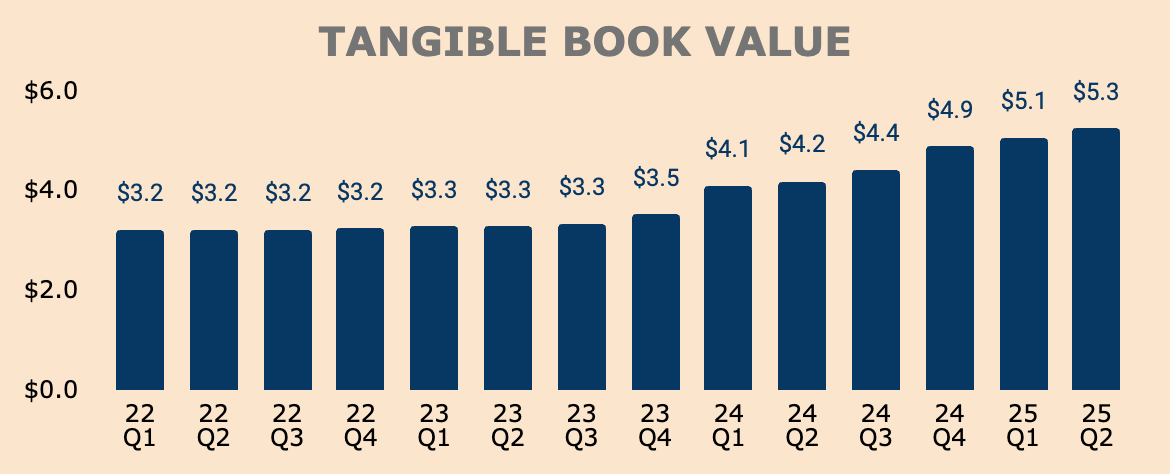
Turning to the balance sheet, SOFI continues to generate higher equity value, with Tangible Book Value up 25% YoY to $5.3B and TBV Per Share up 20% YoY to $4.72. Management expects to end the year with $5.5B of TBV.
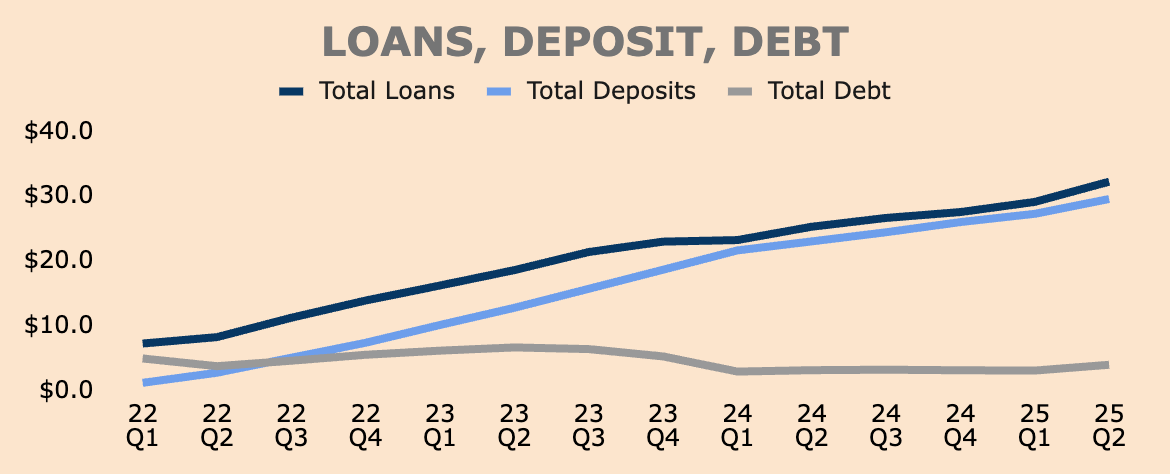
Below, we can see how SOFI’s balance sheet has evolved over the past few years. Notice how Loans and Deposits continue to trend up while Debt has pretty much flatlined. As of Q2,
Total Loans were $32.2B, up $3.1B QoQ.
Total Deposits were $29.5B, up $2.2B QoQ.
Total Debt was $3.9B, up $0.9B QoQ.
SOFI received its bank charter back in Q1 2022, which is when the company began accepting deposits. This was an inflection point for SOFI, as it allows the company to fund the growth of its loan portfolio using consumer deposits, which is much more cost-efficient than using debt.
As an illustration, the average rate on deposits in Q2 was 187bps lower than that of its warehouse facilities, which allowed SOFI to save $552M in annual interest expense, boosting earnings in the process.
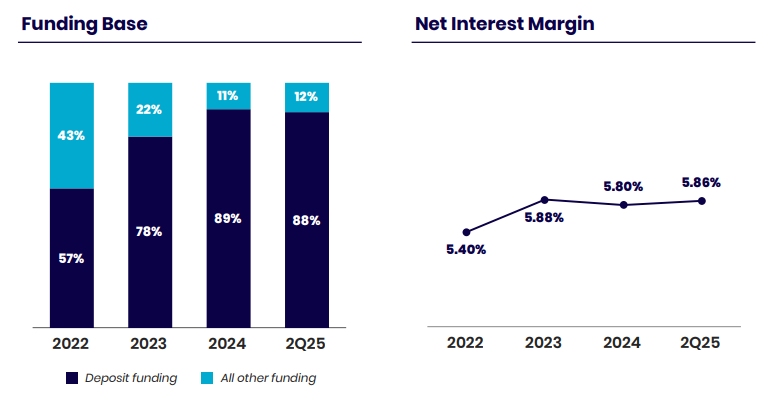
As you can see below, SOFI is currently about 88% deposit funded, up from just 57% in 2022. This drove a 46bps expansion in Net Interest Margin to 5.86%. Management aims to keep SOFI’s funding mix about 85% to 90% deposit-funded, so we can expect Net Interest Margins to remain relatively stable. Management also expects it to stay above 5% for the foreseeable future.
This might not seem like a meaningful difference, but a few extra basis points on billions of dollars of loan volume could translate to hundreds of millions of Revenue for SOFI.
It's also worth noting that, even with its rapidly expanding loan portfolio, SoFi maintained strict credit standards and a disciplined focus on high-quality borrowers.
Our personal loan borrowers have a weighted average income of $161,000 and a weighted average FICO score of 743, while our student loan borrowers have a weighted average income of $136,000 with a weighted average FICO score of 768.
(CFO Chris Lapointe — SOFI FY2025 Q2 Earnings Call)
Additionally, SOFI is showing strong credit performance.
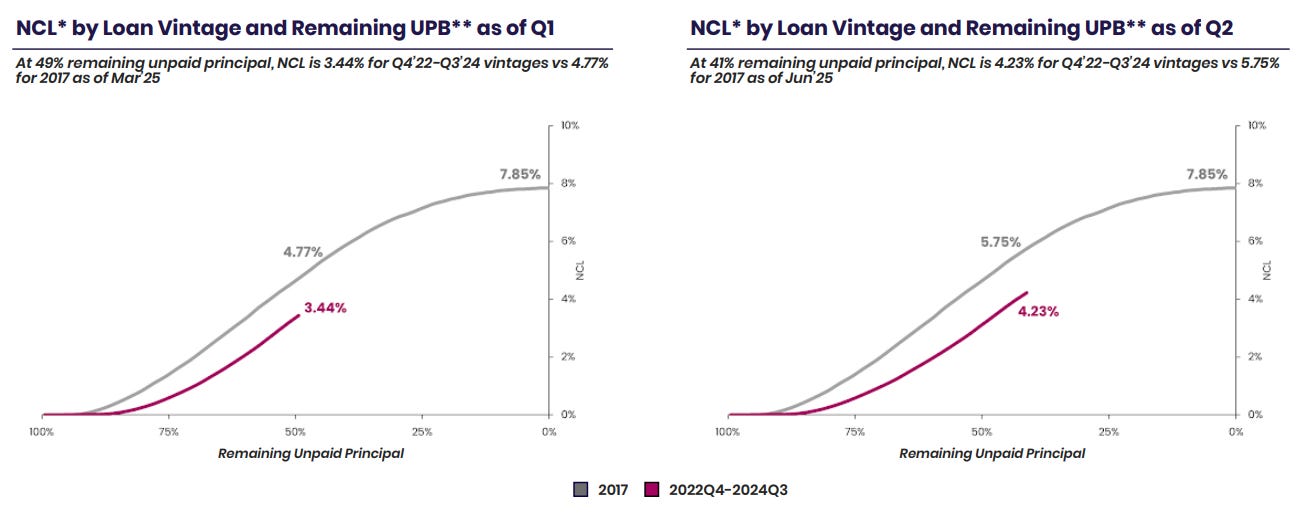
For instance, 59% of SOFI’s recent loan vintages from Q4 2022 to Q3 2024 have already been paid down at a 4.23% Net Cumulative Loss (NCL). This is well below the 5.75% NCL observed for its 2017 loan vintage (at the same 59% paid principal), which is the last vintage that falls within management’s 7% to 8% maximum NCL tolerance.
In addition, with 49% remaining unpaid balance in Q1, there is a 133bps improvement in credit performance between the new cohort and the 2017 cohort. In Q2, with 41% remaining unpaid balance, there is a 152bps improvement in credit performance between the two cohorts.
In other words, from Q1 to Q2, the gap between the newer cohort and the 2017 cohort has widened by 19bps (152bps minus 133bps), translating to better credit performance over time.
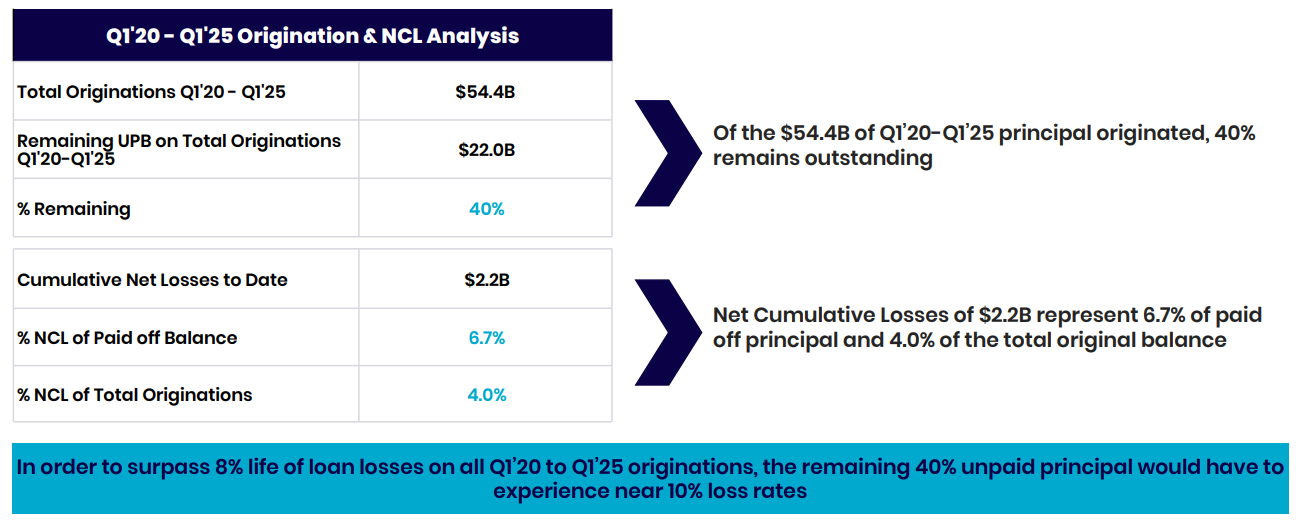
Moreover, of the Q1 2020 to Q1 2025 loan originations, 60% of the principal has already been paid down at a 6.7% NCL. For this entire cohort to reach 8% NCL, the NCL rate on the remaining 40% unpaid principal would need to be approximately 10%, which is very unlikely given SoFi's improving credit performance and underwriting model.
Put simply, SOFI’s balance sheet has never been healthier.
Regarding cash flow, analyzing SOFI’s Free Cash Flow isn't helpful since SOFI operates like a bank. In essence, banks grow by holding more loans on their balance sheets, which significantly reduces Cash Flow from Operations under changes in Net Working Capital. However, it doesn’t take into account the growth of customer deposits, which is reflected in Cash Flow from Financing. As a reminder, SOFI uses customer deposits to fund its loans.
As such, SOFI’s FCF is, more often than not, negative — uninformed investors will be quick to judge that SOFI is a money-losing, cash-burning business.
However, that is not true.
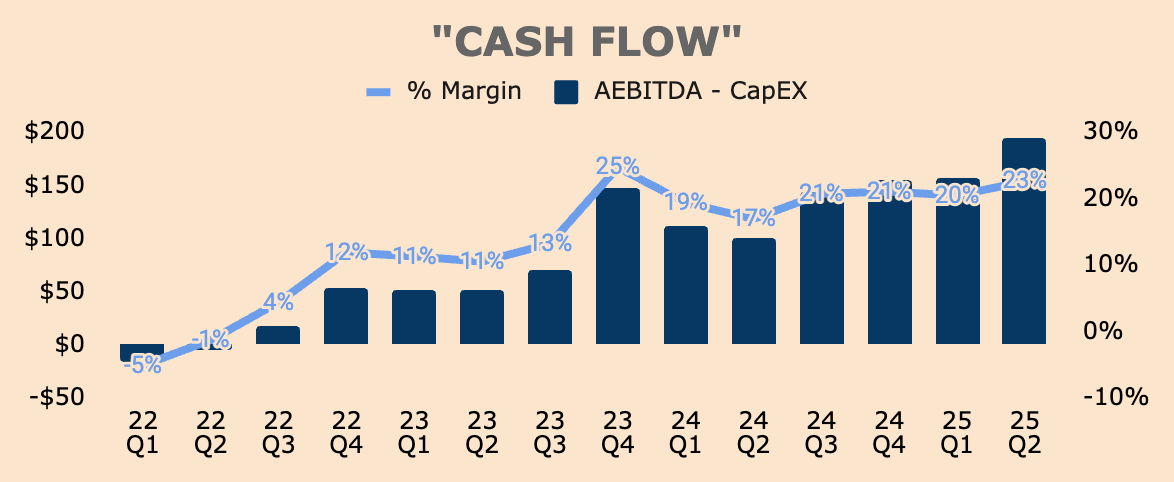
In my view, a more suitable metric to look at is Adjusted EBITDA, which serves as a reliable proxy for cash flow. We have already discussed SOFI’s Adjusted EBITDA, but I want to modify it by subtracting Capital Expenditures, thus resembling the traditional FCF metric a little closer. In this case, I’ll just call it “Cash Flow” — a special metric of mine.
I don’t have CapEx figures for Q2 yet, but I’m guessing it’ll be around $55M — CapEx is historically around 5% to 6% of Revenue. Taking its Adjusted EBITDA of $249M and subtracting CapEx of $55M gives us a “Cash Flow” of about $194M, representing a 23% Margin.
The important point to drive home is that SOFI is cash flow positive.
But despite having $2.1B of Cash and Cash Equivalents and being cash flow positive, why did SOFI recently issue $1.5B of common stock, which it abruptly announced right after posting its Q2 results?
Fortunately, the investor relations team gave us a thorough explanation:
Here is our perspective on what this additional capital means for SoFi and our members. This opportunistic capital raise:
Is a proactive step to provide flexibility to pay down expensive debt and to further strengthen SoFi’s ability to consider opportunistic acquisitions (though none are currently contemplated).
Gives SoFi an even stronger position for potentially greater growth (organic or inorganic) than we currently have planned and communicated over the intermediate to long-term horizon.
Increases SoFi’s net cash position, and the additional net interest income from greater net cash would reduce interest expense, assuming a pay down of debt. As such, the combination is neutral to EPS.
I believe management is taking advantage of the recent price rally by raising capital at an attractive price of $20.85. At this price, shareholders will be diluted by about 7%, which is manageable. If the offering were executed at $10, it’d be a much different story — shareholders would be diluted by about 15% instead of 7%.
Regardless, I’m positive that management will put their fresh capital to good use, generating shareholder value in the long run. After all, they raised their full-year EPS guidance by $0.04. I’m sure they have factored in the dilutive effects of the stock offering in this guidance, and even then, they raised their guidance! That’s how confident management is in building shareholder value!
The next few sections are available exclusively for paid subscribers:
Valuation (including my DCF model and price target)
Risks
Thesis (and what I’m doing)
Keep reading with a 7-day free trial
Subscribe to RS Capital to keep reading this post and get 7 days of free access to the full post archives.