

Portfolio Update: 2025 Performance Review + 2026 Portfolio Strategy
What went right, what went wrong, and how I'm positioning my portfolio for 2026

First off… HAPPY NEW YEAR!
I hope 2025 was a wonderful year for you — filled with love, happiness, and growth. I wish you nothing but the best in 2026… for yourself, your health, your relationships, your portfolio, and many more.
With that, I’d like to review my portfolio over the past year and discuss how I plan to manage it through 2026.
Let’s jump right in.
Portfolio Performance
2025: +33.3% vs. +16.4% SPY
Since inception (22 July 2024): +77.3% vs. +23.1% SPY

What Went Right
Holding through the volatility: The Liberation Day tariffs in April shook the markets big time. It was an uncomfortable few weeks as a year’s worth of gains nearly evaporated due to the selloff. While some panicked and sold, I took the opportunity to add to a few names. I believe the stocks in my portfolio would continue to grow and improve their fundamentals, regardless of Trump’s tariffs. The share price may be volatile, but the fundamentals remain strong. As such, I see no reason to sell.
Removing lower conviction holdings: In 2025, I sold two “undervalued” stocks: LULU and PYPL. I invested in them solely because they were “cheap”. These are companies that did not really align with my investment philosophy, which is to invest in high-growth, high-quality potential multibaggers. Removing them from my portfolio proved to be the right move as the cheap became even cheaper following my sale.
What Went Wrong
Poor downside risk management: While my portfolio outperformed the S&P 500 by 17pp in 2025, I could’ve done a better job of managing my portfolio more actively. At its peak, my portfolio was up 68%, but things turned south in Q4, cutting my 2025 performance by half. Ouch. There were a couple of stocks where I should have sold earlier for a profit, but I chose not to because I got too greedy. PYPL is a great example, which was trading in the 90s at the start of the year. I later sold it for a small profit at $69. In hindsight, I should’ve protected my gains and managed the downside better.
Not buying clear opportunities: In the first half of the year, I released two deep dives: LMND and NBIS. I spent hundreds of hours researching and writing these deep dives, but I made the costly mistake of not buying these names, even though I was bullish on them. When I published those deep dives, LMND and NBIS were trading at $28 and $48, respectively. Throughout the second half of 2025, both stocks rallied as much as 200%, now settling at $71 and $84, respectively. Yes, this one hurts a lot.
Despite my mistakes, my portfolio still doubled the performance of the S&P 500 this year, so it’s still a win for me.
The State of the Markets
It’s been an eventful year.
After being up 24% in 2023 and 23% in 2024, the S&P 500 extended its bull run in 2025, up 16%. It’s even more impressive if you consider the fact that the S&P 500 was down 15% through April — the stock market actually rallied 41% from its April lows to close the year 16% higher. That’s wild.
Now, the market is sitting just 1% off its all-time highs.
The Forward PE ratio of the S&P 500 is currently at 23x (the chart below is as of October). The 20-year average is about 17x, so the market is trading 35% higher than its mean. In other words, the market is looking quite expensive.
And if you look at the chart below, every time the S&P 500 crosses over 20x Forward PE, it subsequently enters a period of multiple compression, so from a valuation standpoint, the market is at a particularly vulnerable position at the moment.

You see the tiny red dot in the chart below? That’s us today.
If you have trouble understanding the chart, it shows the historical relationship between the S&P 500 Forward PE ratio and subsequent 10-year annualized returns. And since we’re at a 23x Forward PE today, the expected return of the S&P 500 over the coming decade is… ZERO. Yikes.
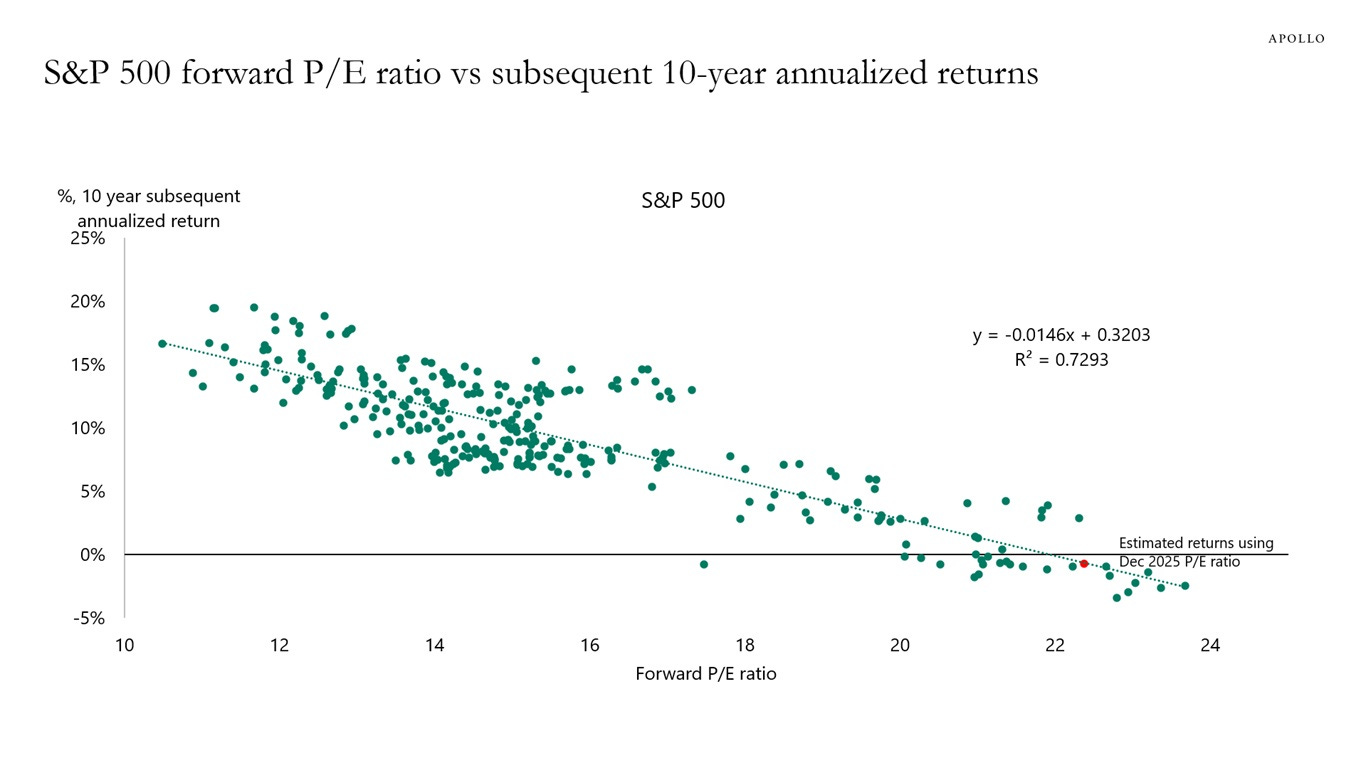
The takeaway here is that the market is expensive, and as such, expected returns over the next few years are very low.
What does it mean for us investors? Well, we need to manage risk appropriately.
I’m not saying that we should sell everything and forget about the stock market for the next 10 years. No. The bull market could potentially run another few months or years — you don’t want to miss all the fun.
What I’m saying is that we should prepare for a market correction. For me, this involves trimming overvalued positions and lower conviction holdings, and building a nice cash buffer, so I have some dry powder to take advantage of market selloffs. I want to be in a position where I can buy high-quality companies at a discount.
Timing the market is nearly impossible, so when do we start buying the dip… the correction… the crash?
Well, I like to look at two indicators.
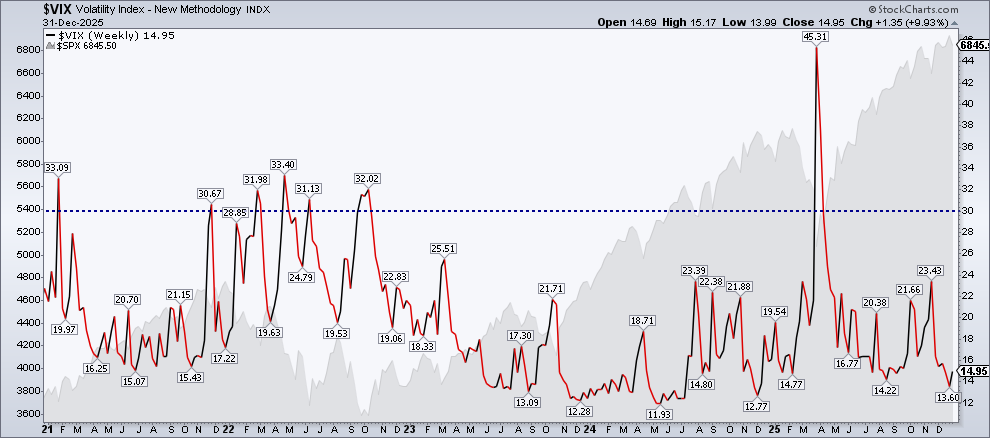
First, the VIX, which measures the volatility of the S&P 500. This is the “fear gauge” — the higher the reading, the greater the fear, and thus, the better the opportunity.
In the chart below, I overlaid the price of the S&P 500 behind the main VIX chart. As you can see, the best buying opportunities occur when the VIX crosses above 30 (blue dotted line). Whenever this happens, we see significant dips in the S&P 500.
This rarely happens — only once in the last three years, during Liberation Day in April this year, and then a handful of times during the 2022 bear market. So, if the VIX crosses 30, it is likely a great time to start accumulating shares of your favorite stocks.
For now, the VIX reads 15. No panic, no fear. Yet.
The second indicator is the percentage of S&P 500 stocks above the 200-day simple moving average (SMA).
Today, about 60% of the S&P 500 is trading above the 200-day SMA, which shows bullish momentum.
If it drops below 50%, momentum is fading. If it drops below 25%, then sentiment is low enough to warrant a buy.
As you can see, the percentage rarely drops below 25% (only about 7 times in the last decade), but when it does, it usually indicates a bottom.
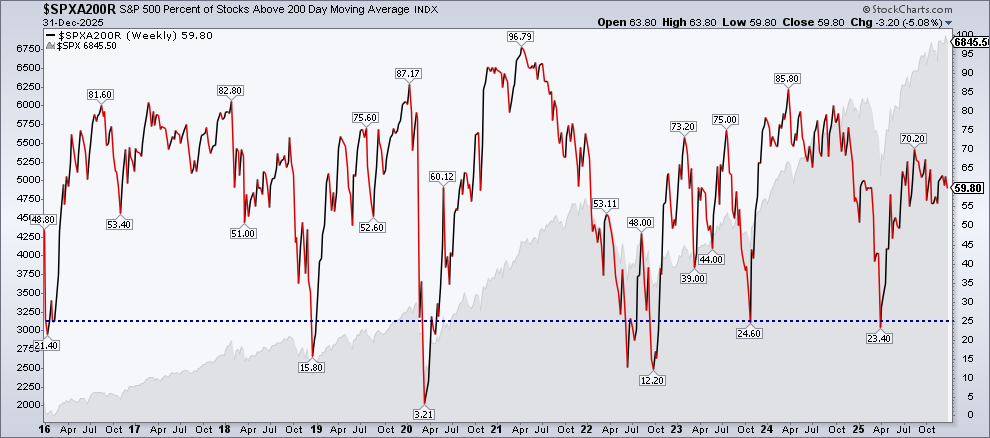
With that in mind, I’ll monitor these two indicators closely. To be clear, I do make purchases even when these indicators have not reached the blue lines, but it is when the blue lines are breached that I’ll be deploying my capital much more aggressively.
In short, the stock market looks expensive, and I don’t see any reason to go all out on stocks. Instead, I’d be more cautious in 2026.
Portfolio Strategy for 2026
Considering the strong bull run over the last three years and the current state of the markets, here’s my plan for 2026:
Invest in undervalued, quality companies
Trim overvalued positions
Increase cash allocation
Now, let me quickly recap all my trades in 2025.
Then, I’ll go over each of my positions.
2025 Trades
As always, portfolio holdings and live trades are reserved exclusively for paid subscribers. If you would like to gain full access to my portfolio and support my work, please consider upgrading to the paid tier.
With that, I have made a total of 10 trades since launching this Substack in July of this year. Here are the articles that cover these trades.
In chronological order, here’s a recap of all my trades since July:
Keep reading with a 7-day free trial
Subscribe to RS Capital to keep reading this post and get 7 days of free access to the full post archives.