

SoFi Technologies (SOFI): Setting The Bar Low
Q1 2026 Earnings Review

SOFI reported Q1 earnings results last week.
In this article, I’ll review the earnings report and share my thoughts about the stock moving forward.
Q1 Update
Earnings Recap
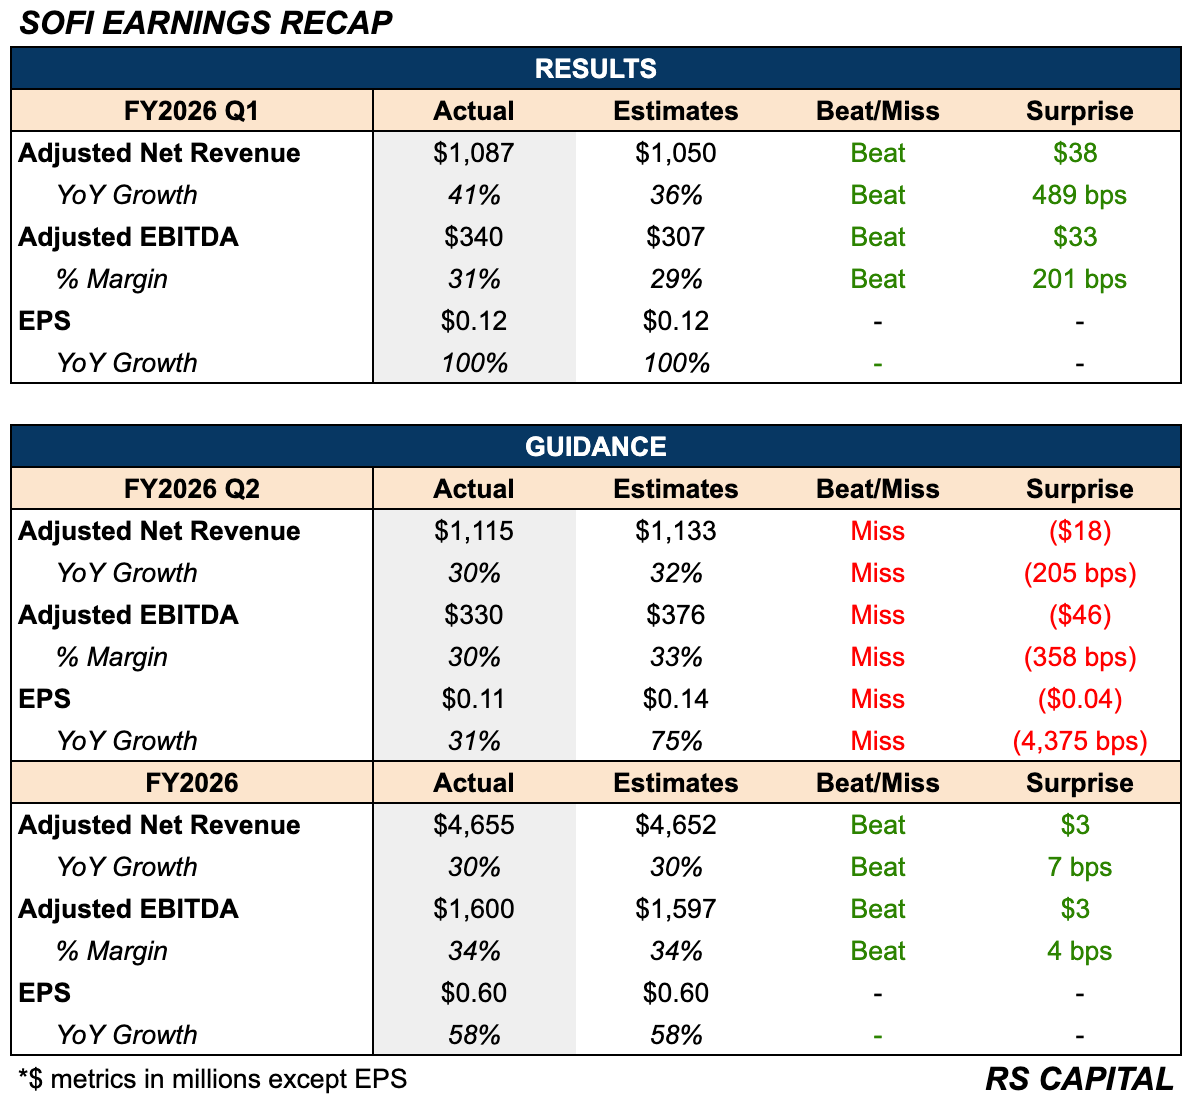
Investors have been accustomed to SOFI’s consistent track record of beating estimates and raising guidance, but for the first time in a very long time, SOFI did not raise their full-year guidance.
Despite a very strong Q1, management issued soft Q2 guidance and reaffirmed their full-year guidance. This is why the stock tanked 15% post-earnings.
Growth
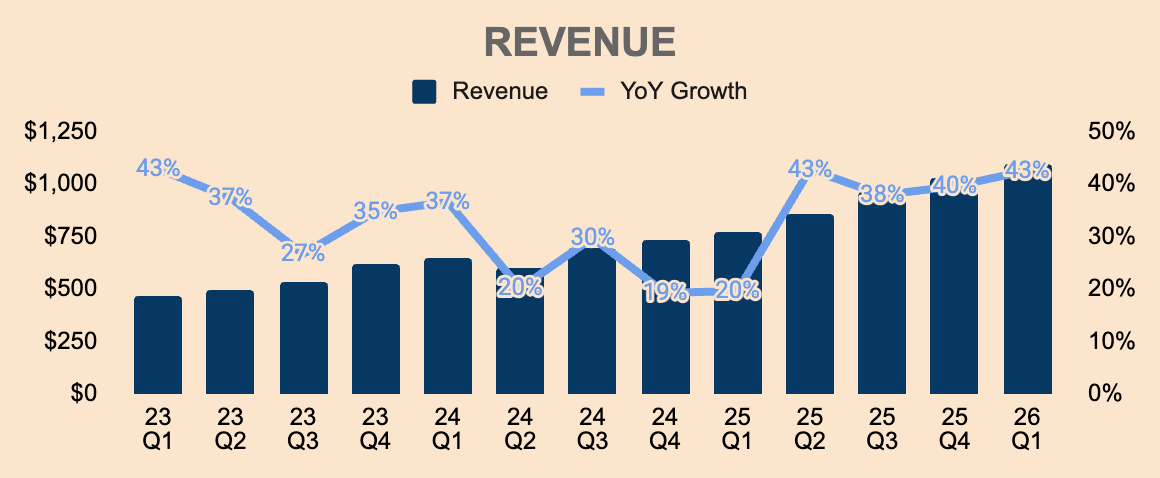
Revenue: $1.1B (+43% YoY)
Adjusted Revenue: $1.1B (+41% YoY)
Members: 14.7M (+35% YoY)
Products: 22.2M (+39% YoY)
SOFI’s topline metrics continue to reach record highs.
Revenue growth accelerated sequentially, driven by strong Member growth and Product adoption.
In Q1, Members grew 35% for the third straight quarter. The company added a record 1.1M new Members sequentially.
SOFI also added a record 1.8M new Products in the quarter. Lending Products grew 33% YoY (6 straight quarters of acceleration) while Financial Services Products grew 40% YoY (3 straight quarters of acceleration).
Notably, 43% of new Products came from existing Members, up 7 pp from the prior year, reflecting strong cross-buying momentum.
Net Interest Income was $693M, up 39% YoY. Net Interest Margin was 5.94%, up 22bps QoQ.
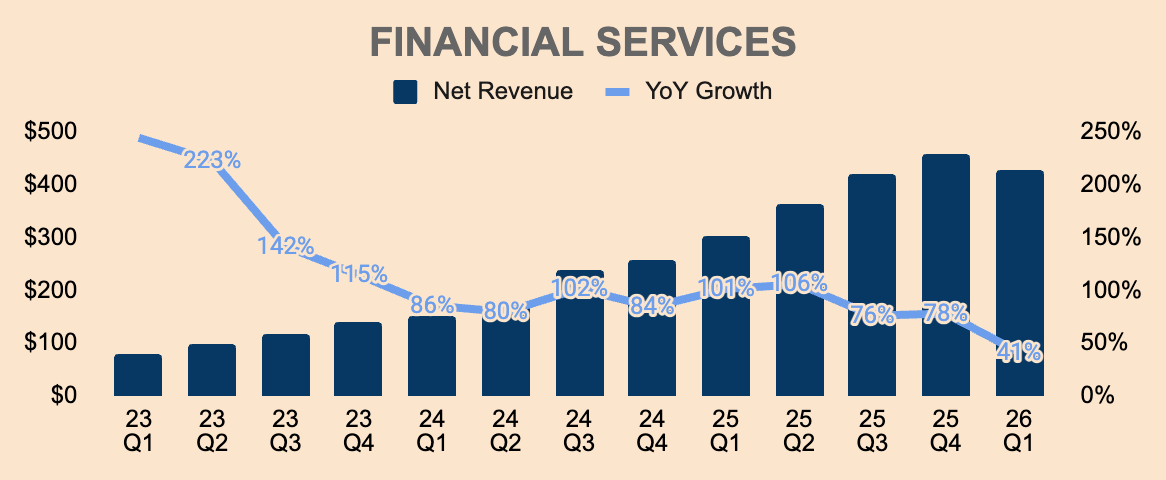
Financial Services Revenue: $429M (+41% YoY)
Loan Platform Business Revenue: $141M
In Q1, the Financial Services segment grew 41% YoY, dropping below 50% for the first time and decelerating 37pp QoQ. In addition, Revenue declined 6% QoQ, marking the first QoQ decline for the segment in nearly 5 years.
This was due to a “slowdown” in the Loan Platform Business (LPB). In Q1, LPB Revenue was $141M as compared to $194M in Q4.
However, this was not a demand problem for SOFI — management was just more confident in taking more balance sheet risk.
You see, SOFI can channel loan volumes through its balance sheet or the LPB. While holding loans on its balance sheet involves some level of credit risk, it does generate stronger Revenues over the life of the loan as compared to transferring those loans to a third party through the LPB.
Balance sheet originations → capital-heavy with default risk → high, recurring net interest income.
LPB originations → capital-light with no default risk → small upfront fee-based Revenue.
In Q1, management decided to channel more personal loans to its balance sheet rather than the LPB, resulting in lower LPB Revenue — Q1 LPB volume was $3.0B as compared to $3.7B in Q4. This dynamic, however, drove stronger Revenue generation in the Lending segment. But it is important to note that SOFI is doing this in a position of financial strength.
Given our very strong capital ratios, we channeled nearly $5.4 billion of personal loans to our balance sheet and approximately $3 billion through our Loan Platform Business. This deliberate decision resulted in lower LPB originations relative to the fourth quarter, although LPB originations were up 90% year-over-year.
Regardless, SOFI is still seeing significant demand from institutions, which should keep volume through the LPB robust in future quarters.
On the loan platform, business demand from capital partners, it remains extremely robust. We announced several partnerships last year with Blue Owl, Fortress, and others, and those partnerships are going extremely well. Each of the partners is buying at their contractual level, and even above that in several quarters. Each of our partners who have come up on term in their existing contracts have extended their contracts.
In addition to that, we recently signed up and announced three new partnerships totaling about $3.6 billion of commitments over the course of the next two years, and that comes from a large investment bank, a large asset management firm, and an insurance fund.
On a side note, interchange fee Revenue grew 54% YoY in Q1, driven by nearly $25B in total annualized spend across SoFi Money and Credit Card.
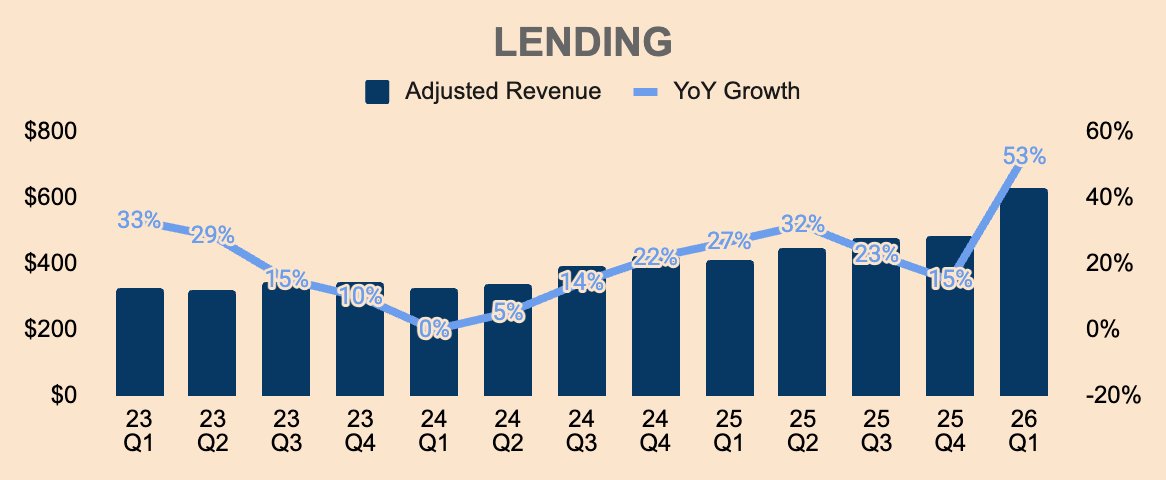
Lending Adjusted Revenue: $629M (+53% YoY)
Loan Originations: $12.2B (+68% YoY)
Lending Adjusted Revenue growth accelerated 38pp QoQ to its highest growth rate in 5 years. This was driven by higher loan volumes channeled to its balance sheet, as mentioned earlier, as well as record Loan Originations of $12.2B, up 68% YoY, which is the highest growth rate since the company went public!
All three Lending segments generated record volumes. In Q1, Personal Loan, Student Loan, and Home Loan originations were $8.3B, $2.6B, and $1.2B, up 51%, 119%, and 137% YoY, respectively.
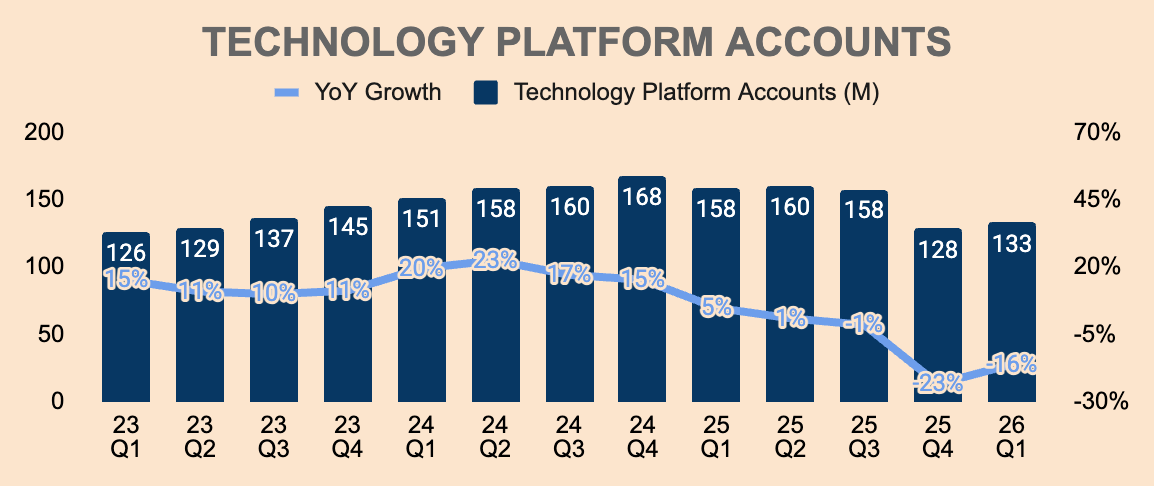
Tech Platform Revenue: $75M (-27% YoY)
Tech Platform Accounts: 133M (-16% YoY)
The Tech Platform segment was a clear underperformer, declining double-digits in the most recent quarter. This was due to a large client fully transitioning out of the platform in Q4.
The silver lining is that Tech Platform Accounts increased 5M sequentially. Moreover, excluding the exiting client, Tech Platform Revenue actually grew 12% YoY. Encouragingly, management expects growth to accelerate from here, driven by existing and new clients.
The tech platform revenue, if you do like for like on a year-over-year basis, was up about 12% year-over-year. We expect that the year-over-year growth rate on a like-for-like basis to accelerate throughout the year, both from our existing members’ growth as well as new partner adds. We mentioned in the prepared remarks that we have 13 new partners that have launched in Q1 2026 and generated revenue in Q1 2026 that were not generating revenue in Q1 of 2025. That revenue will scale over time. It doesn’t come instantly.
Obviously, 2026 growth will be lackluster due to the exiting client. However, management is determined to get this segment back to 20-25% compounding growth over time. To get to this, they are planning to launch a new unified brand, SoFi Technology Solutions, which offers clients an all-in-one financial solution, covering processing, banking, payments, and risk.
Profitability
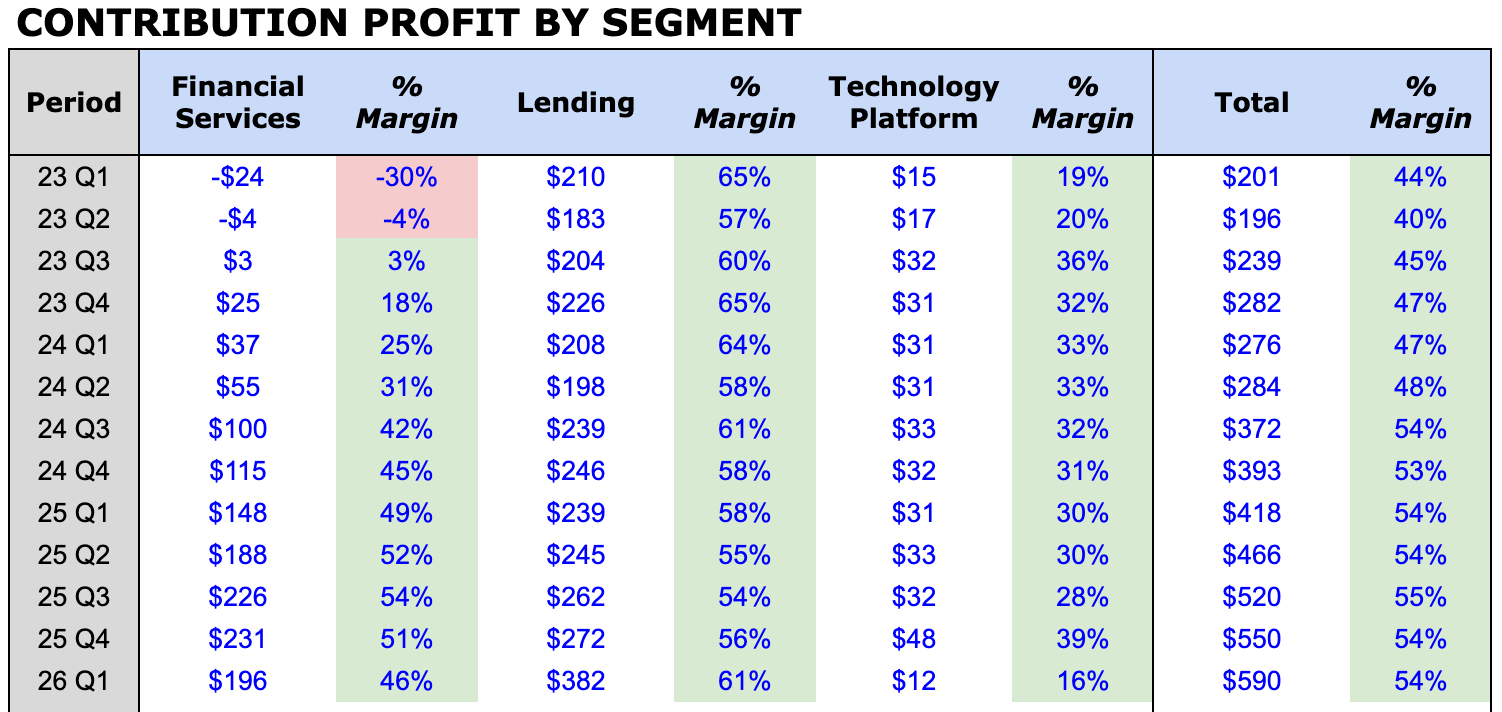
Contribution Profit: $590M (+41% YoY)
Contribution Margin: 54% (Flat YoY)
Financial Services and Tech Platform Contribution Profits both declined sequentially, due to lower Revenue. Margins also compressed sequentially.
Fortunately, they were well covered by the Lending segment, which produced a record Contribution Profit of $382M, up 60% YoY, with Margins expanding 3pp YoY and 5pp QoQ, to 61%.
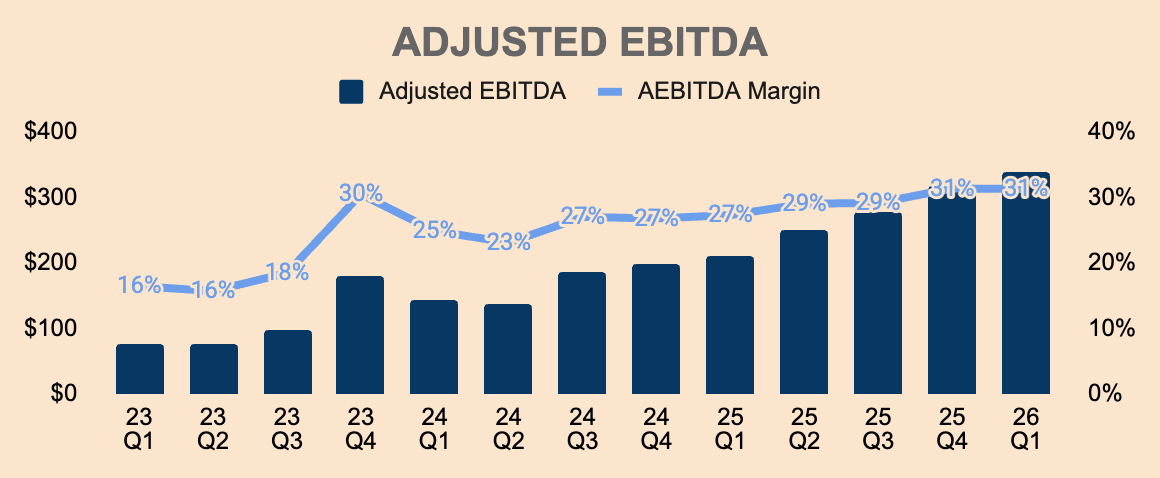
Adjusted EBITDA: $340M (+62% YoY)
Adjusted EBITDA Margin: 31% (+4pp YoY)EPS: $0.12 (+100% YoY)
Adjusted EBITDA grew to a record $340M, with Margins expanding 4pp YoY to 31%. Incremental Adjusted EBITDA Margin was 41%, reflecting significant room for margin expansion.
SOFI’s Rule of 40 score was 72 in Q1, demonstrating robust growth and profitability, as well as a sustainable moat for long-term earnings generation.
GAAP Net Income was $167M, and GAAP EPS was $0.12.
Health
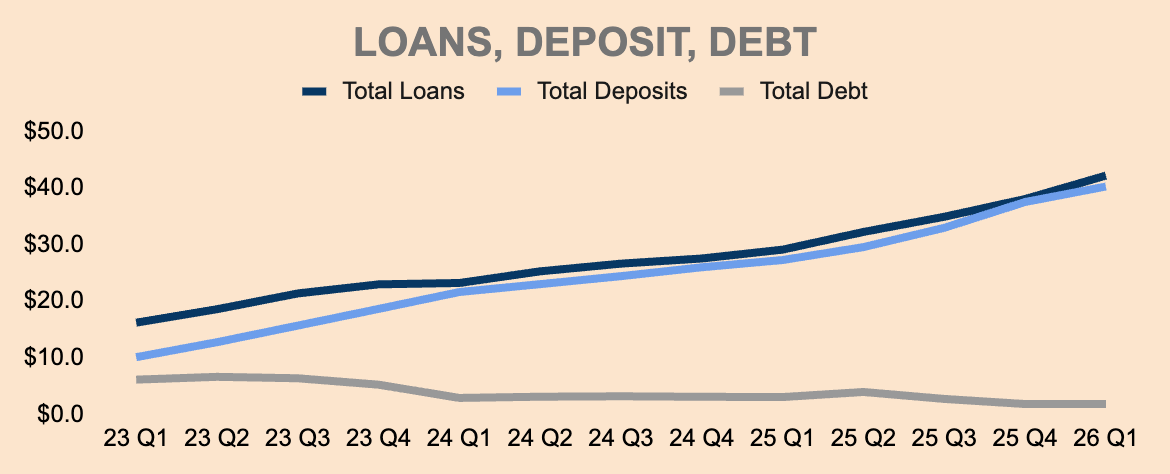
Cash: $3.4B (-$1.5B QoQ)
Total Loans: $42.2B (+$4.2B QoQ)
Total Debt: $1.8B (Flat QoQ)
Total Deposits: $40.2B (+2.7B QoQ)
Cash levels dropped $1.5B QoQ while Deposits grew $2.7B QoQ. This totals to $4.2B, which was used to fund loan growth. Notice how debt levels remain flat QoQ. This enabled SOFI to save $622M of annualized interest expense as the average rate paid on deposits was 155bps lower than that on warehouse facilities.
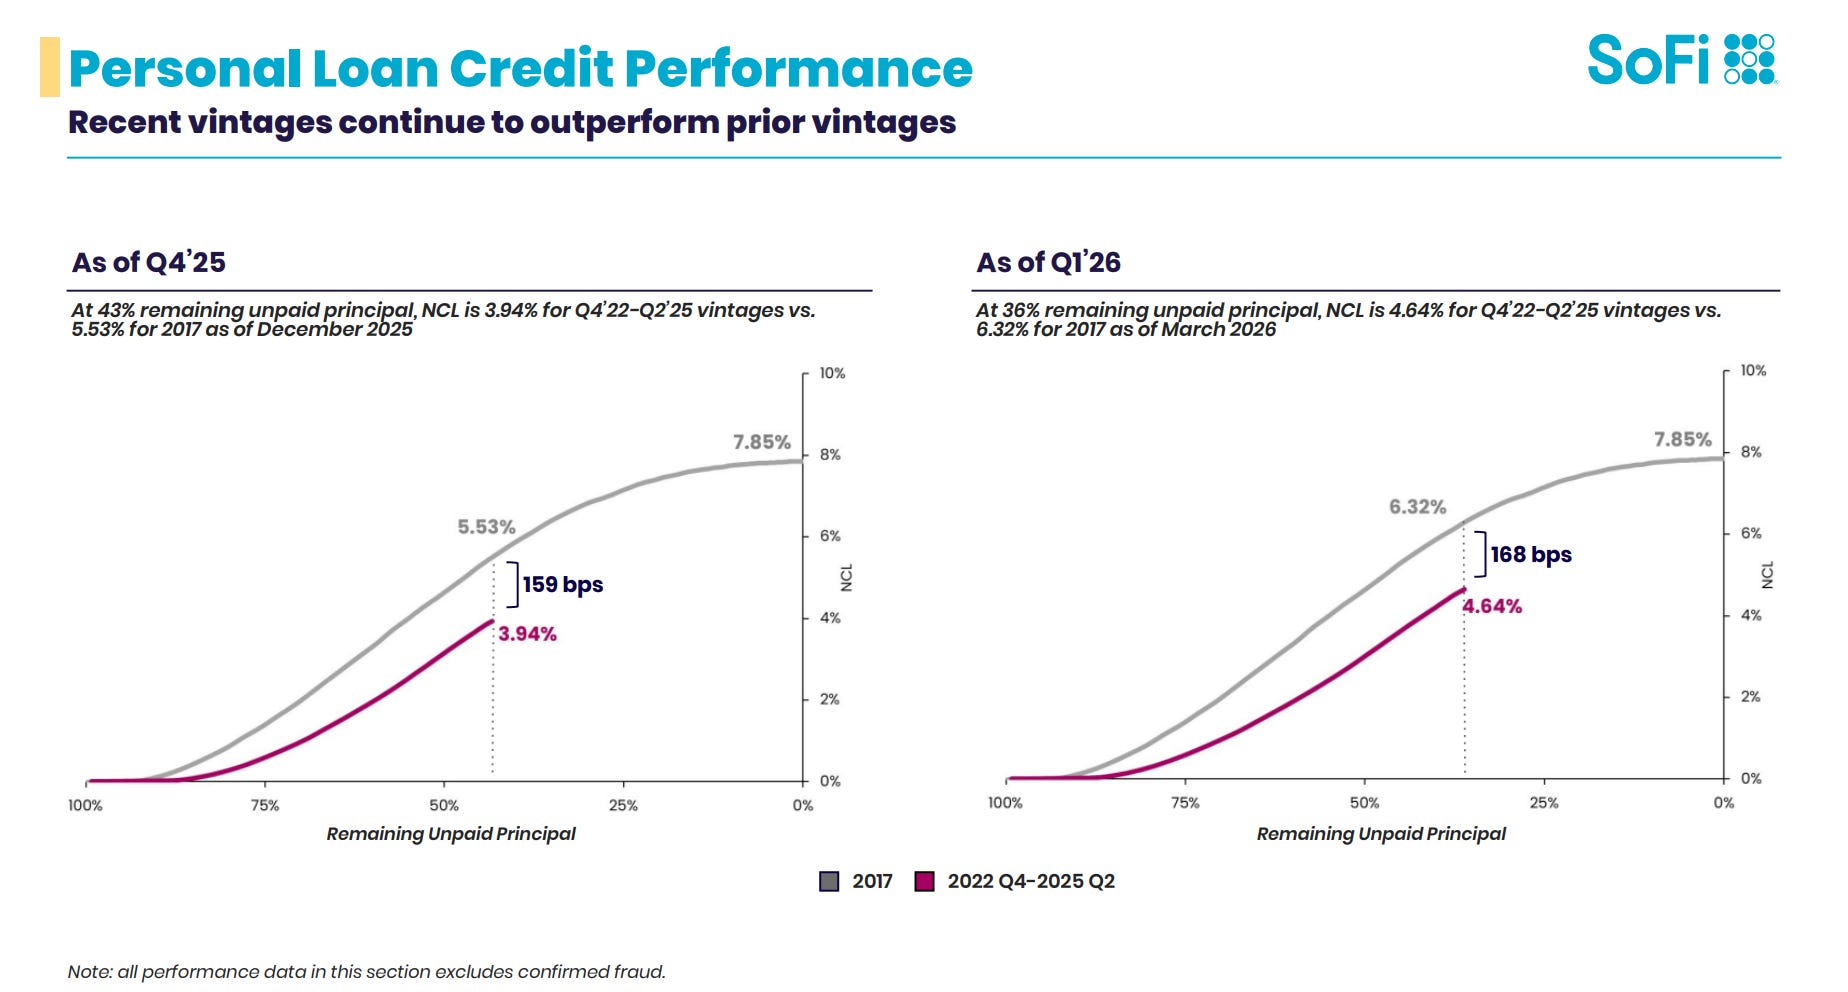
Per management, SOFI’s credit performance remained strong, aligning with expectations and delivering attractive returns across all loan types.
SOFI’s personal loans remain well below the company’s 7-8% underwriting tolerance, with recent vintages performing better than older cohorts.
Credit performance has been strong as we reported. We have a, you know, a early warning dashboard that looks across a number of macro and microeconomic factors in the performance of our own loans as well. If that turns yellow and then red, we reduce the tiers that we’re willing to underwrite. We’re not in that, in that situation in any way, shape, or form. The current loans are performing well. The macro is also continuing to perform well.
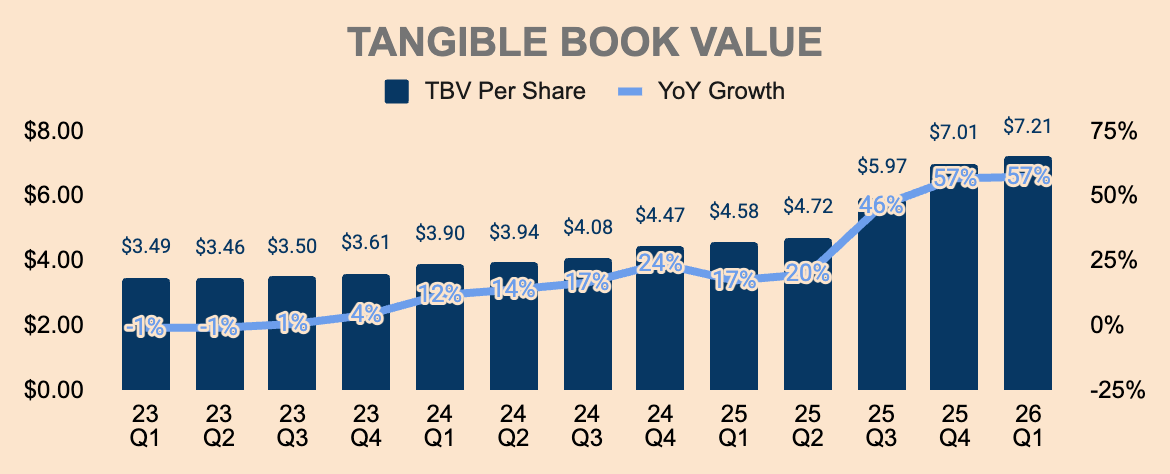
Tangible Book Value: $9.2B (+83% YoY)
TBV/Share: $7.21 (+57% YoY)
Importantly, TBV continued to grow at a robust clip, a clear indication of shareholder value creation.
Q1 Summary
SOFI delivered yet another strong set of results. Growth remains exceptionally strong, fueled by the Financial Services and Lending segments. The Tech Platform segment, on the other hand, is not up to par. But as a whole, SOFI is in hypergrowth mode.
The best part is, its rapid growth is accompanied by strong operating leverage, resulting in robust earnings growth — this momentum will likely continue for years to come.
What’s Next?
Guidance
Q2 Adjusted Revenue: $1,115M (+30% YoY)
Q2 Adjusted EBITDA: $330M (30% Margin)
Q2 EPS: $0.11 (+38% YoY)
2026 Adjusted Revenue: $4,655M (+30% YoY)
2026 Adjusted EBITDA: $1,600M (+34% Margin)
2026 EPS: $0.60 (+54% YoY)
Investors were just too used to SOFI beating and raising guidance, but in this quarter, SOFI missed Q2 expectations and did not raise its full-year guidance — thus, the selloff.
Investors didn’t care about the fundamentals. They just want a beat and raise.
While it’s a shame that SOFI did not continue this well-worn tradition, there’s one positive takeaway from the guidance.
What most investors miss is that, back in Q4, management provided FY2026 guidance based on expectations of two rate cuts in 2026. In this Q1 update, they are now expecting zero rate cuts.
In line with market expectations, we now expect an interest rate outlook consistent with the Fed funds futures and no rate cuts in 2026.
And even with the gloomier outlook, management reaffirmed their full-year guidance.
To me, it’s as good as raising guidance.
But imagine if we actually get a rate cut or two this year. SOFI would easily beat their current guidance.
Nevertheless, reaffirming guidance in the backdrop of a deteriorating macroeconomic environment is actually impressive.
Even so, management is not seeing any concerns in the private credit market. In fact, management is seeing a “flight to quality” as capital market participants are pleased with SOFI’s credit performance.
Some people will raise the question about concerns about private credit. We’re not really seeing any issues in our own performance, nor in the demand that we have for LPB revenue and loans from our partners. In fact, we have demand above our contractual obligations that we have on volume that we’re producing.
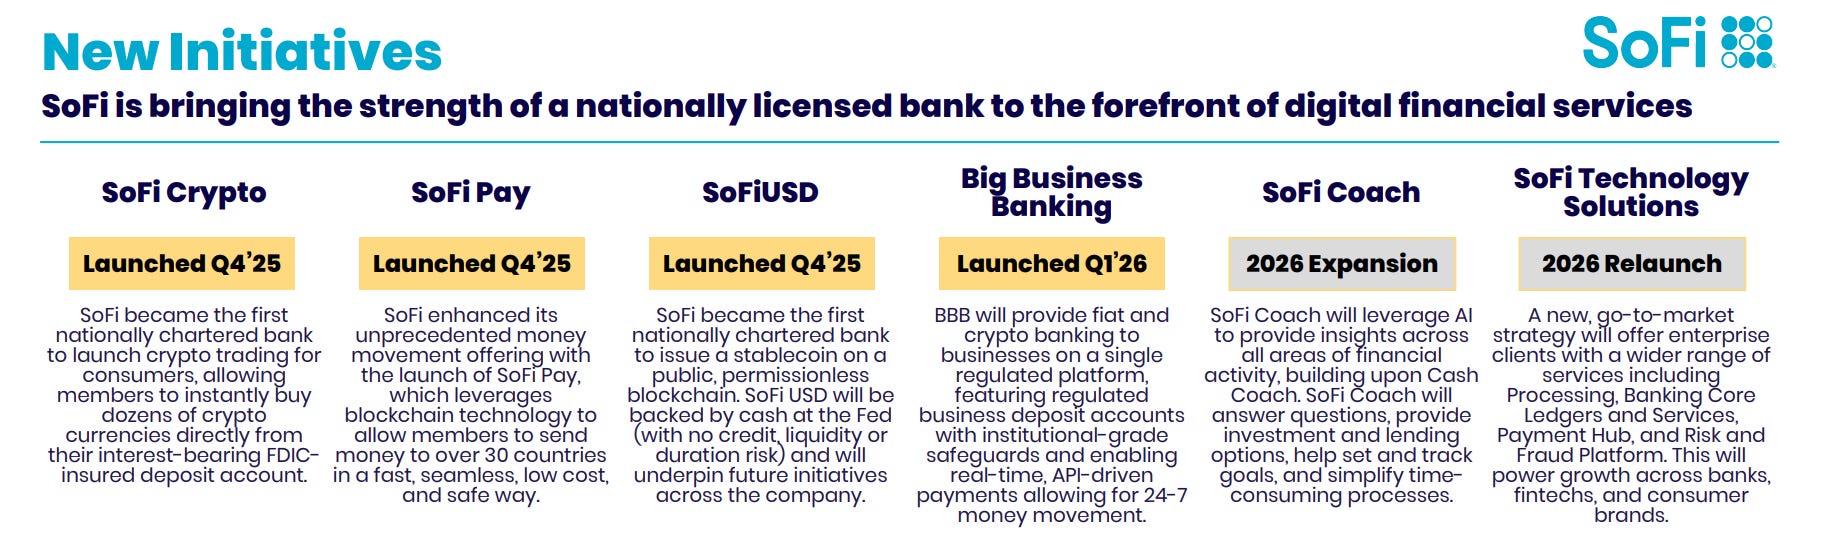
That being said, growth is expected to remain robust, and margins are set to expand in the back half of the year. With new products like SoFi Crypto, SoFiUSD, SoFi Pay, Big Business Banking, SoFi Plus, Personal Loan Doc Coach, Home Equity Line of Credit, and the upcoming SoFi Technology Solutions, 2026 looks to be a pivotal year for SOFI.
Moreover, management reiterated their medium-term guidance of at least 30% Adjusted Revenue CAGR and 38% Adjusted EPS CAGR through 2028.
As a SOFI investor, I can’t complain.
Valuation
The rest of this article is exclusive to paid subscribers. It includes:
My thoughts on valuation
My price target
My plan — what I’m doing
Keep reading with a 7-day free trial
Subscribe to RS Capital to keep reading this post and get 7 days of free access to the full post archives.